


 585 / 762

Chapter 13: Confidence Intervals – Small Samples
585
Definition:
is a
-score with
-1 degrees of freedom such that
area is to the right
of the
-score value where
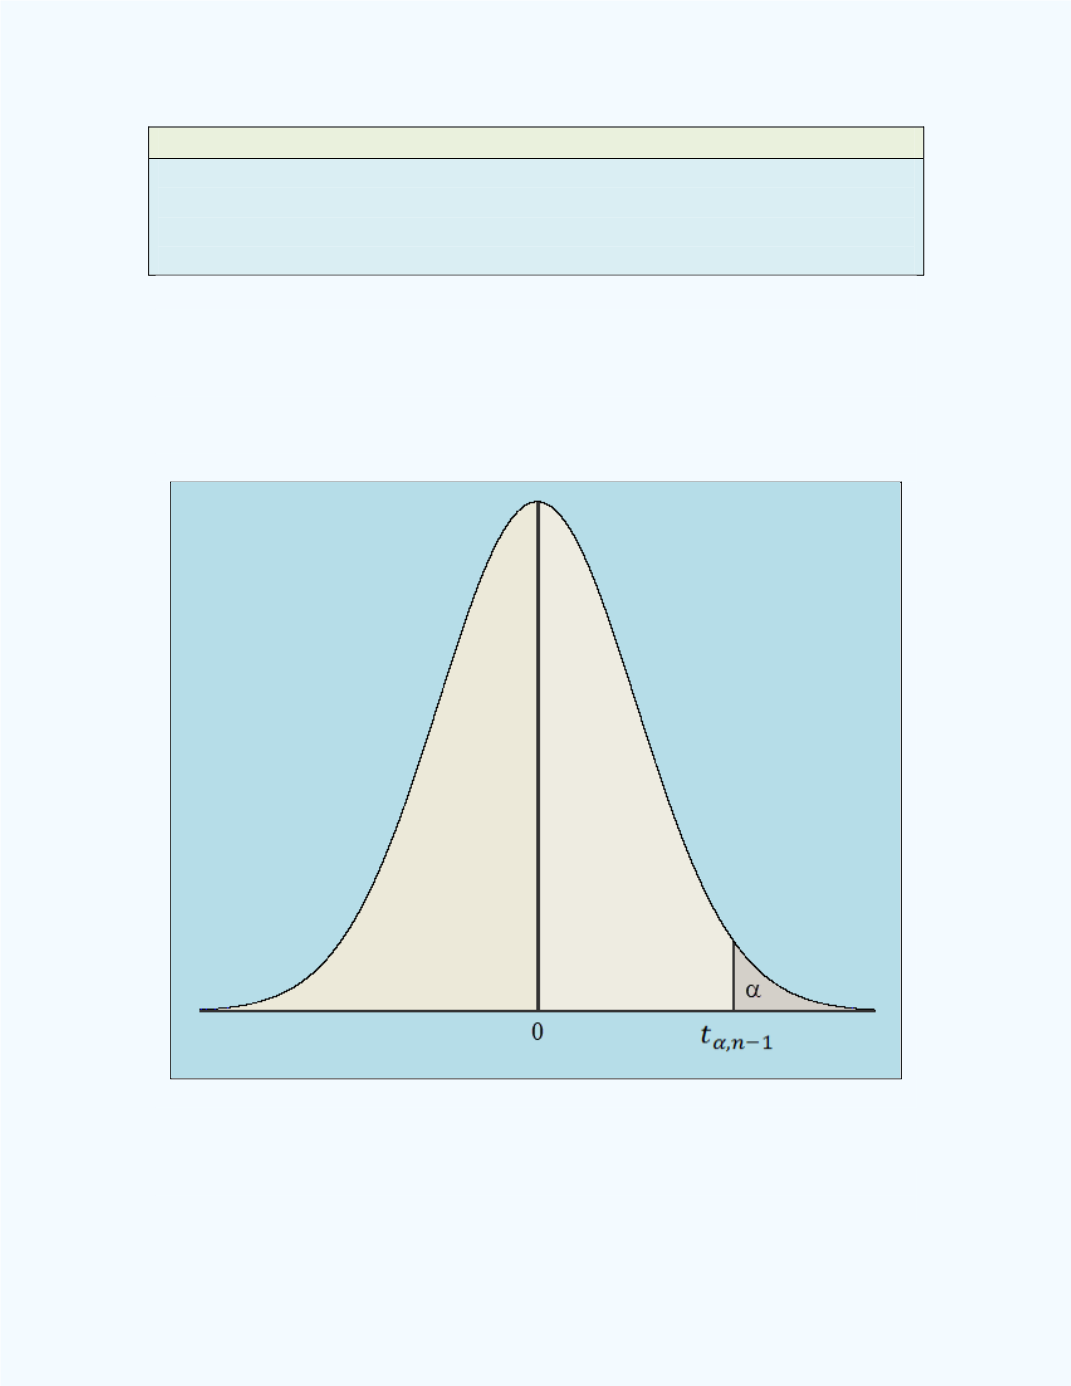
The diagram in
Figure 13-2
explains the notation. The figure assumes that
the value of
is small so the
t
-value will be in the right tail of the
distribution and will be a positive value. If the value of
was large (> 0.5),
then the
-value will be located in the left tail of the distribution and will be
a negative value.
Figure 13-2:
Diagram explaining the notation
Values for
scores with the appropriate degrees of freedom can be obtained
from appropriate
-tables or one can use the appropriate technology. Here