


 584 / 762

584
Chapter 13: Confidence Intervals – Small Samples
values are selected, the 10
th
value must be a specific number. It must be the
number such that the sum of all the numbers is 10
3 = 30. Thus, the degrees
of freedom are 10 – 1 = 9.
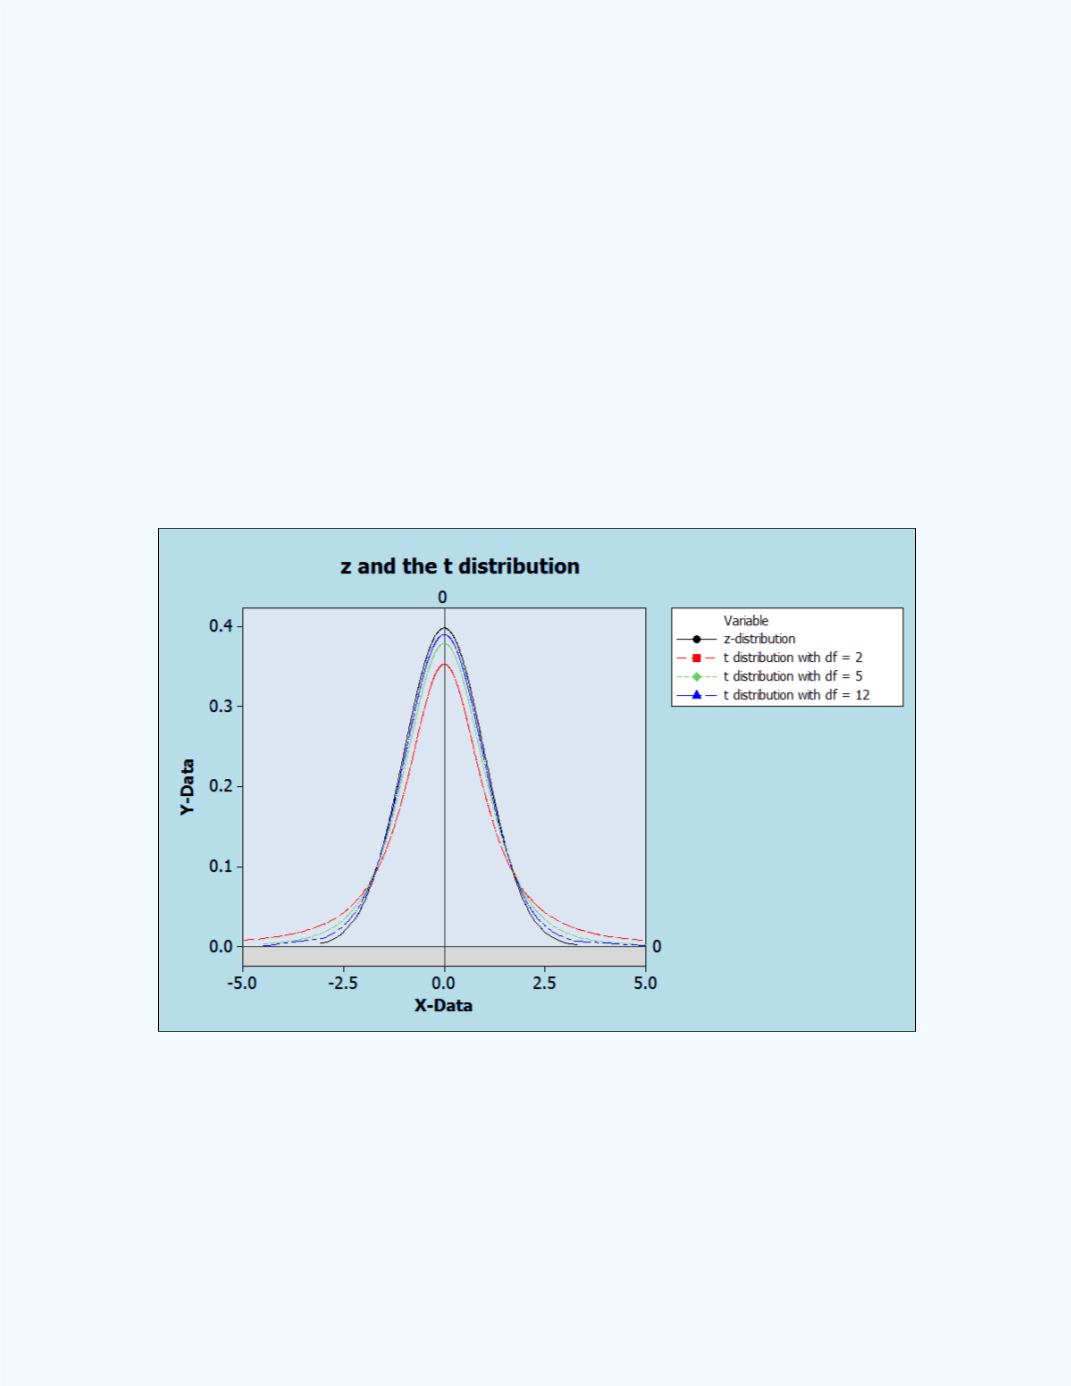
The degrees of freedom associated with a
-distribution tells us which
distribution we should use.
Figure 13.1
displays three
-distributions with various degrees of freedom.
In addition, the standard normal distribution (
distribution) is also
displayed. Observe that as the value of the degrees of freedom is
increasing, the
-distribution is converging into the
-distribution. The
-distribution may be approximated by the
-distribution for sample sizes of
at least thirty.
Figure 13-1:
Comparison between the standard normal
distribution and the
t
distribution
In order to state formulas that can be used to compute the small sample
confidence intervals for a population mean, we need to be familiar with the
notation
(read as “
sub alpha with
n –
1 degrees of freedom”).