


 571 / 762

Chapter 12: Hypothesis Tests – Large Samples
571
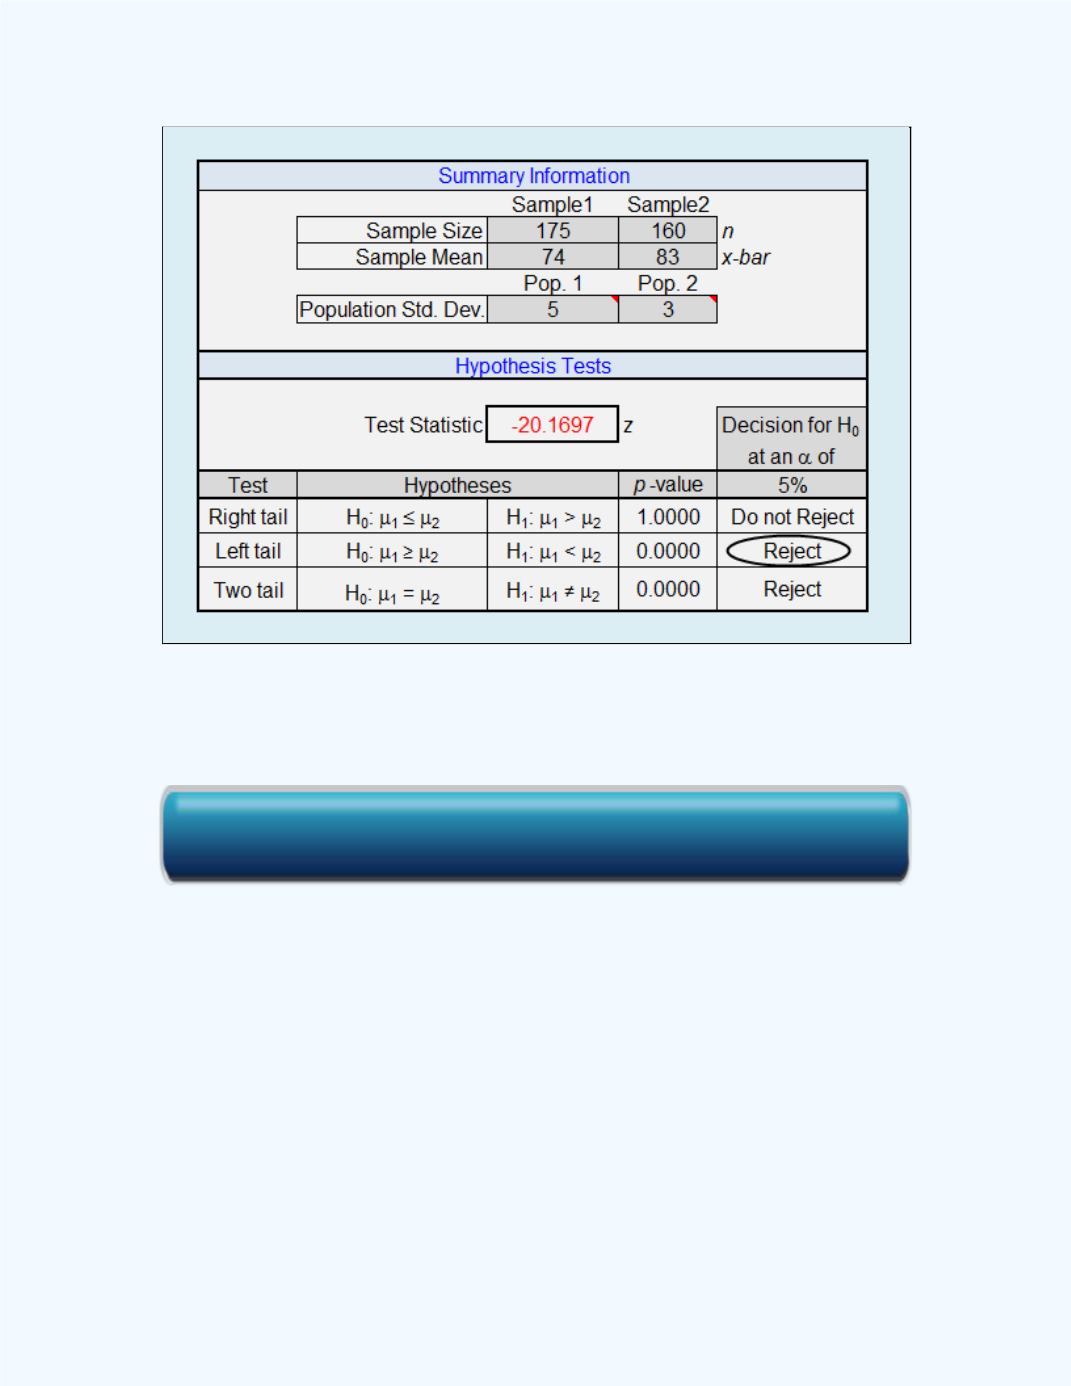
Figure 12- 30:
Display of the Large Sample Test for the
Difference BetweenTwo Population Means
Workbook for
Example 12-14
P-Value Approach
Solution:
:
:
P
-value = 0.0000 (from
Figure 12-30
)
: For a significance level
= 0.05, reject the null hypothesis if the
computed
P
-value = 0.0000 <
= 0.05.
Click here for the Large Sample Test for the Difference Between Two Population Means Workbook