


 573 / 762

Chapter 12: Hypothesis Tests – Large Samples
573
̅
̅
√
=
√
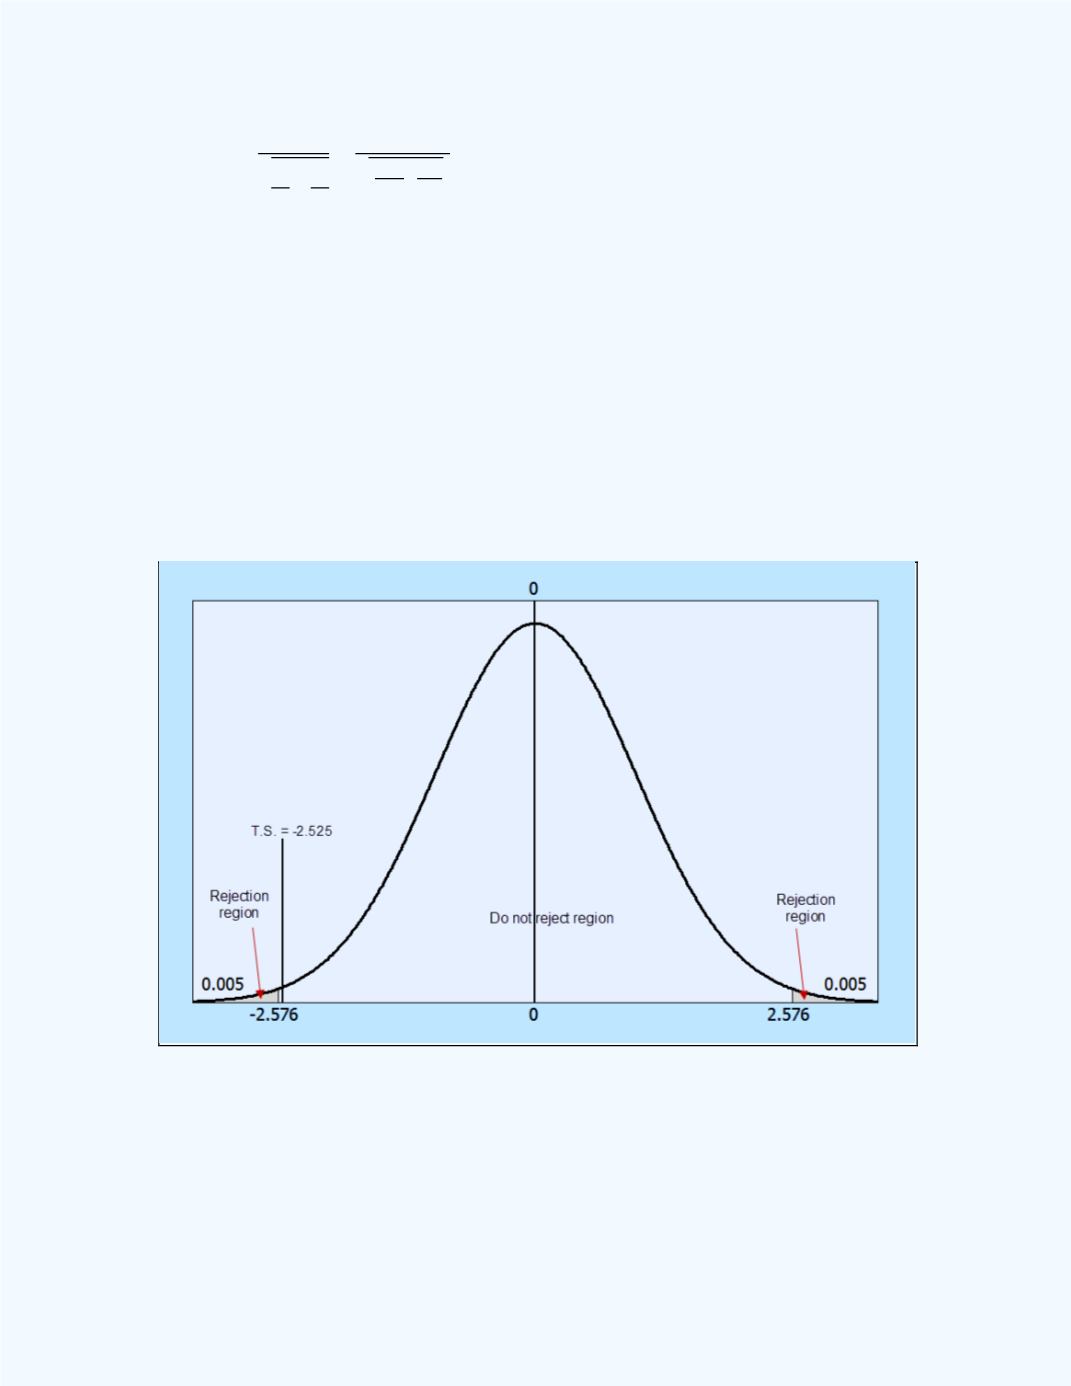
= -2.5250
For a significance level
= 0.01, reject the null hypothesis if the
computed test statistic value
= -2.525 < -
= - 2.576 or if
= -2.525
>
= 2.576 (this is equivalent to |
| >
|-2.525| = 2.525 >
2.576).
Conclusion
:
Since 2.525 < 2.5758, do not reject the null hypothesis. That is,
there is not a significant difference between the two normal population
means at the 1% level of significance.
Figure 12-31
shows the test statistic in relation to the rejection region.
Figure 12-31:
Display of the test statistic in relation to the
rejection region for
Example 12-15
We can also use the
P
-value approach to test the hypothesis.
Figure 12-32
shows the output from the
Large Sample Test for the Difference Between
Two PopulationMeans
workbookwith the computations. The
P
-value =