


 545 / 762

Chapter 12: Hypothesis Tests – Large Samples
545
support the client’s claim that the average meal price for a couple is not
equal to $52 at the 5% level of significance.
Note:
There is not a significant difference between the sample mean and the
postulated value of the population mean of $52.
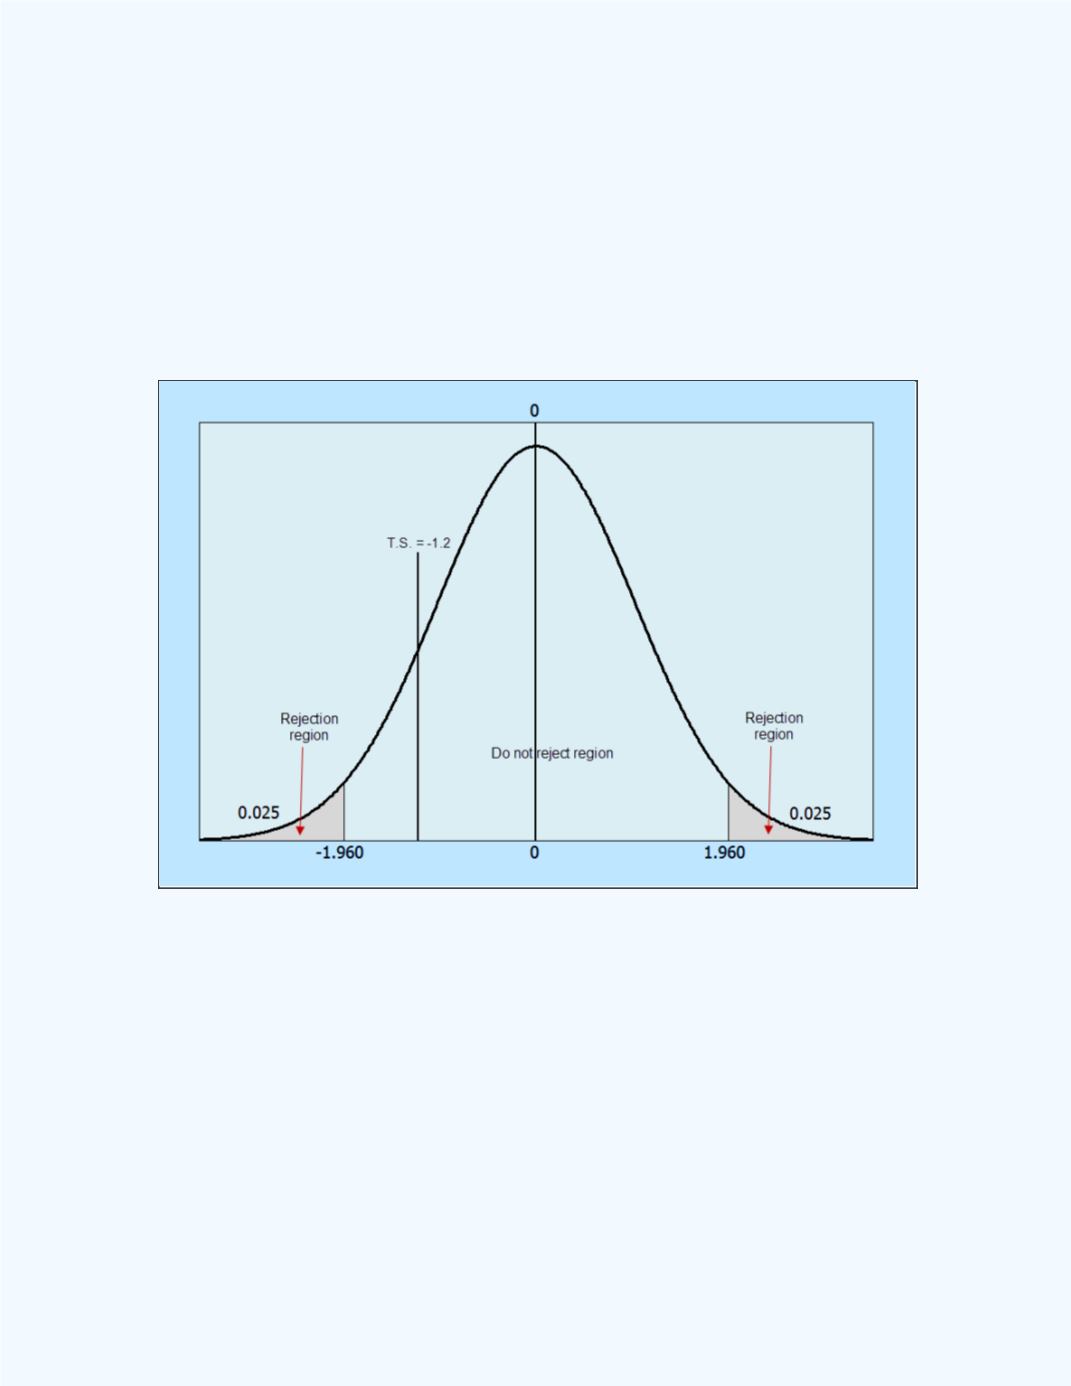
Figure 12-16
displays the test statistic in relation to the rejection region.
Observe that the test statistic falls in the do not reject region.
Figure 12-16:
Display of the test statistic in relation to the
rejection region for
Example 12-8
Note:
We can also use the
Large Sample Test for a Single Population
Mean
workbook to help with the computation for this example.
The output is given in
Figure 12-17
. It shows that the
P
-value = 0.2301
>
= 0.05 (5%) so the null hypothesis will not be rejected and one will
have the same conclusion.