


 528 / 762

528
Chapter 12: Hypothesis Tests – Large Samples
Figure 12-5:
Display of the test statistic in relation to the
Rejection Region for
Example 12-3
Note:
We can also use the
Large Sample Test for a Single Population
Proportion
workbook to help with the computation for this example.
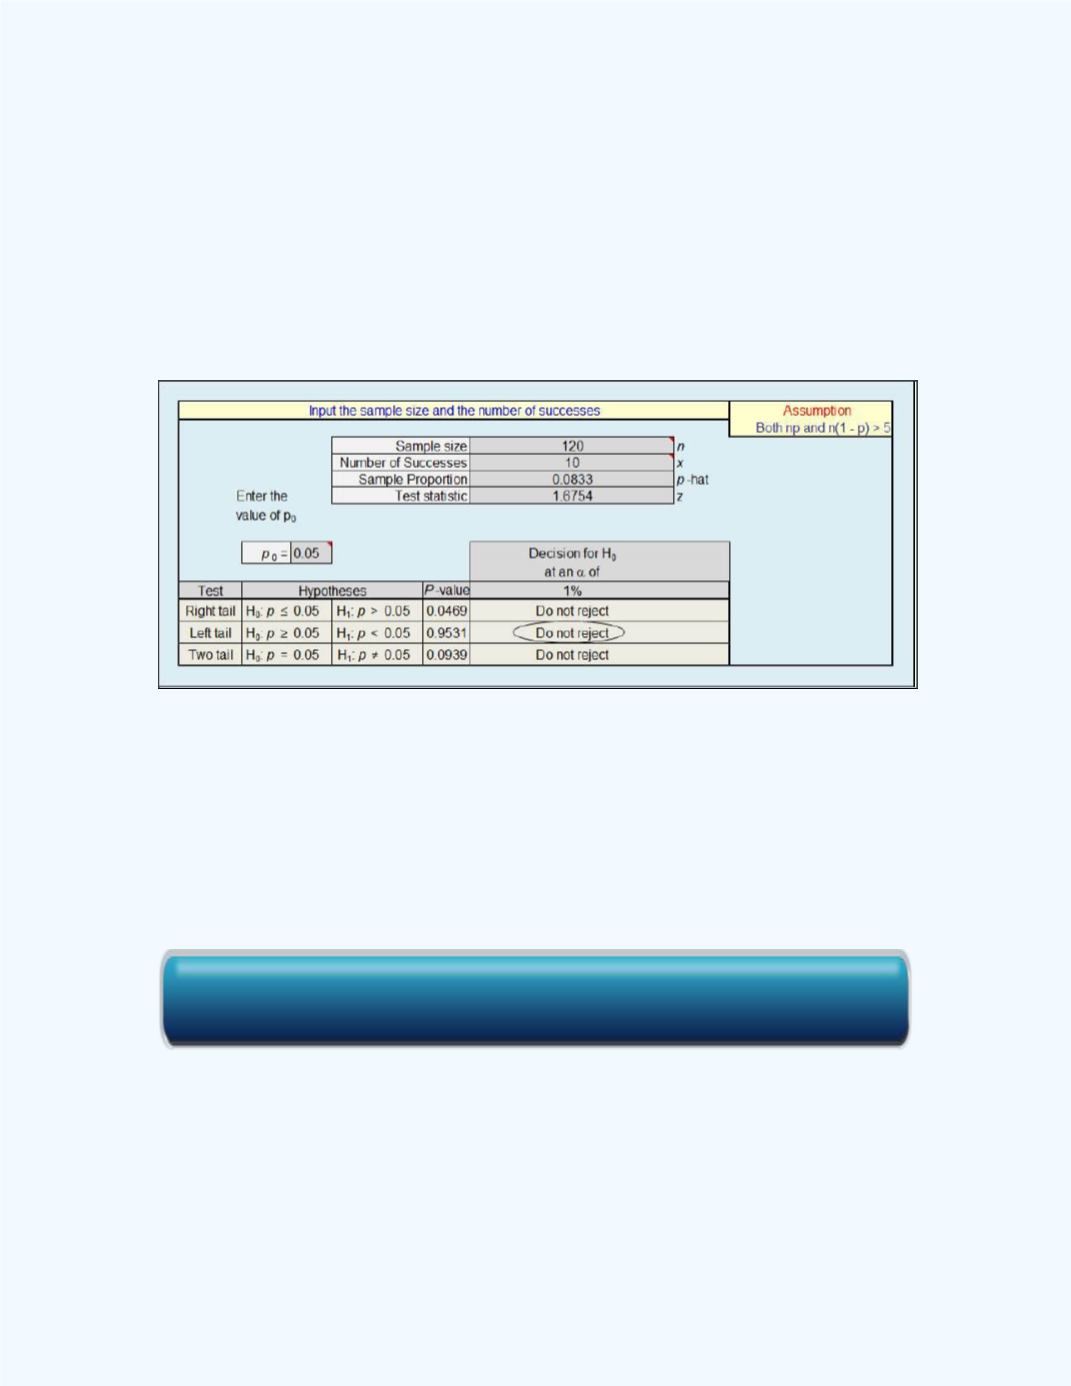
Figure 12- 6
shows the output from the workbook. It shows that the null
hypothesis will not be rejected for the left-tailed test.
Figure 12- 6:
Display of the Test for a Single Population
Proportion workbook output for
Example 12-3
The output is given in
Figure 12-6
shows that the
P
-value = 0.9531 >
=
0.01 (1%) so if we use the
P
-value approach to perform the test, the null
hypothesis will not be rejected and one will have the same conclusion as
when the classical approachwas used.
(c) Two–tailed Test
(where
is a specified proportion value)
Click here for the Large Sample Test for a Single Population Proportion Workbook