


 524 / 762

524
Chapter 12: Hypothesis Tests – Large Samples
Figure 12-3:
Display of the test statistic in relation to the
Rejection Region for
Example 12-2
Note:
We can also use the
Large Sample Test for a Single Population
Proportion
workbook to help with the computations for this example.
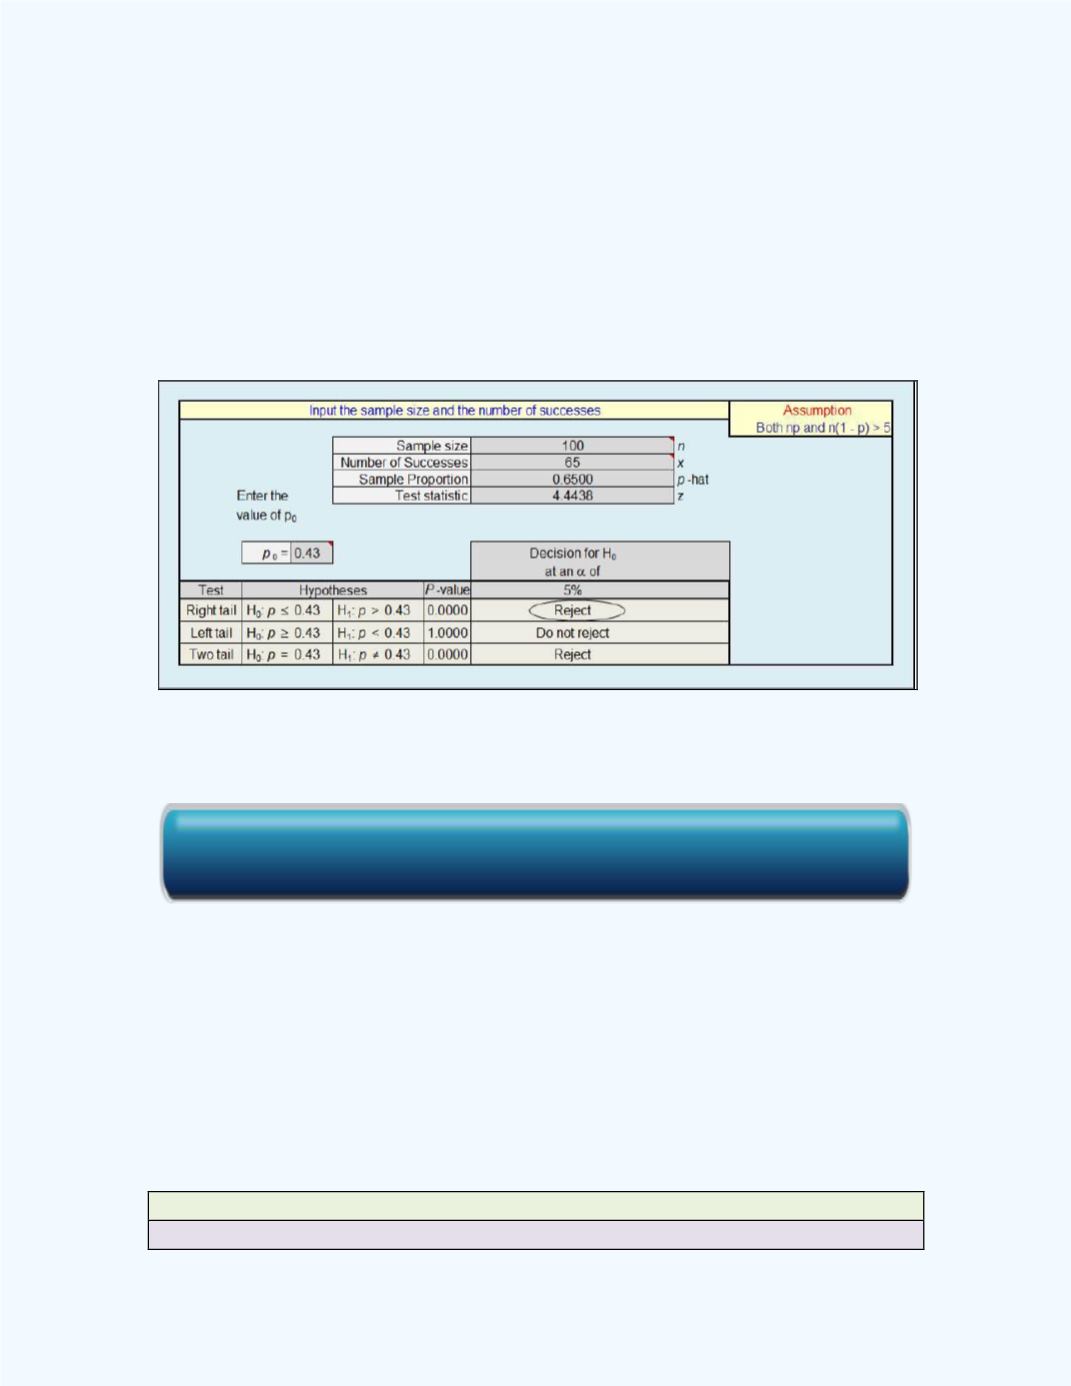
Figure 12-4
shows the output from the workbook. It shows that the null
hypothesis will be rejected.
Figure 12- 4:
Display of the Test for a Single Population
Proportion workbook output for
Example 12-2
Next we will discuss the
P
-value approach
to hypothesis testing.
P
-Value Approach to Hypothesis Testing
With the advent of the computer and other forms of technology, such as
calculators, certain probabilities can be readily computed and used to help
make decisions in hypothesis testing. One such probability value is called
the
P
-value.
Definition:
P
-Value
Click here for the Large Sample Test for a Single Population Proportion Workbook