


 522 / 762

522
Chapter 12: Hypothesis Tests – Large Samples
Example 12-2:
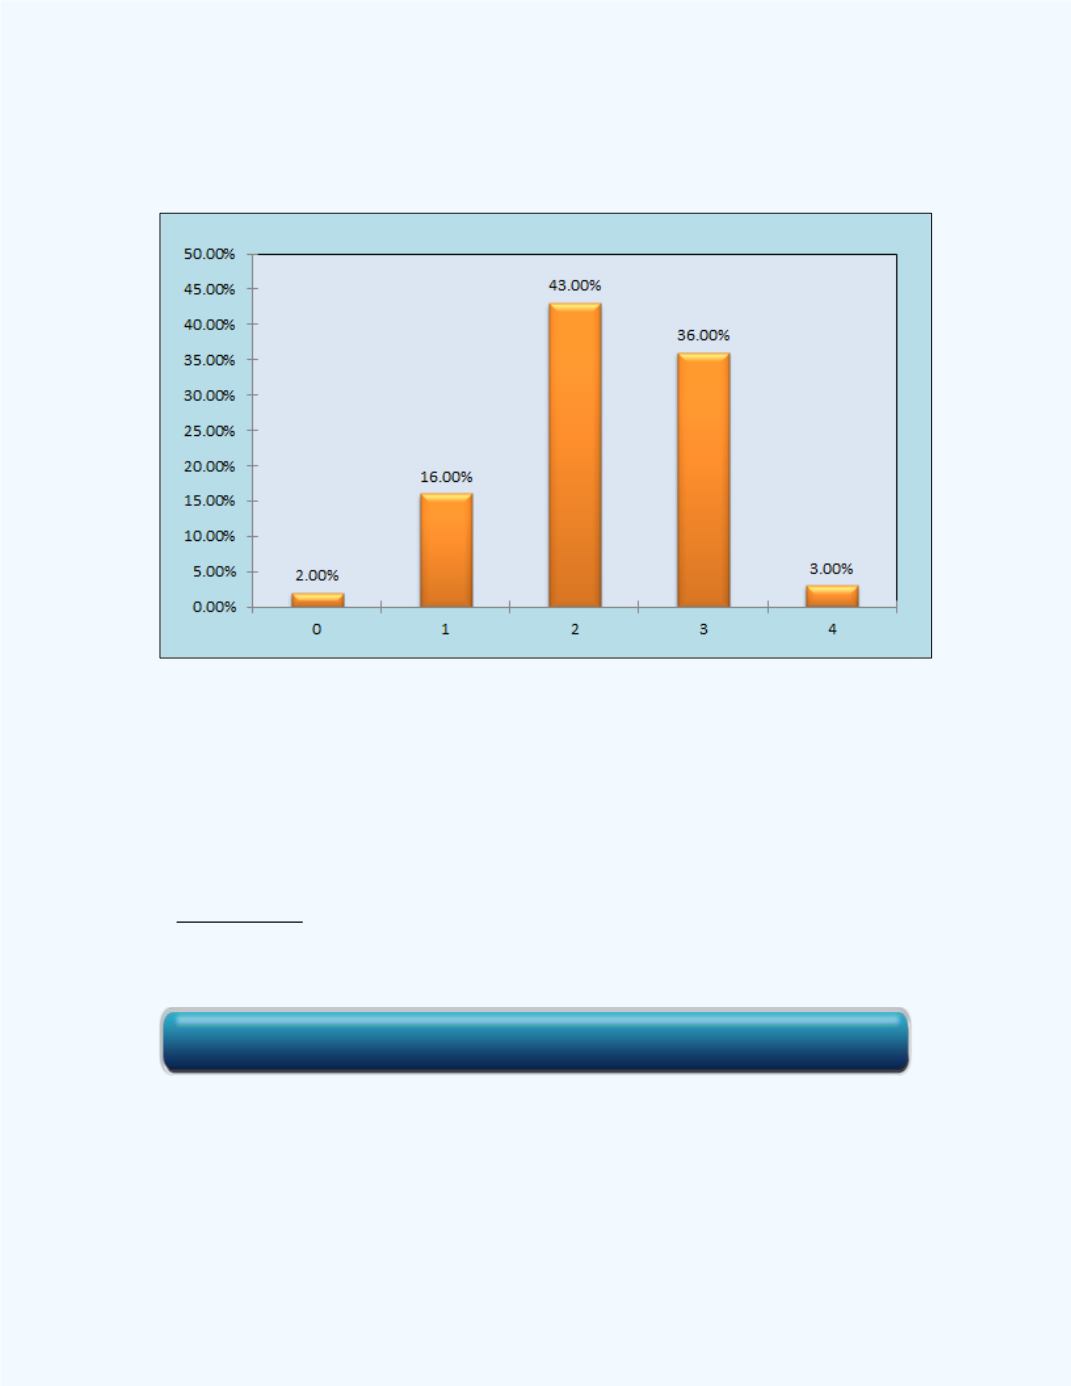
The graph below shows the research information on the
number of meals adults say they eat each day.
Having looked at the graph, your teacher feels that the proportion is higher
for adults who eat two meals per day. She took a random sample of size 100
adults and found that 65 of them said that they ate two meals per day. Test
your teacher’s claim at the 5% level of significance.
Summary Information:
=100,
(number of successes) = 65,
= 0.05,
= 1.645 (this value can be obtained by using the
Inverse Normal
Distribution
workbook), and
= 0.43 (from the graph). Also,
√
= 4.95076.
Since your teacher feels that the proportion is higher, the alternative
hypothesis should reflect this belief.
Click here for the Inverse Normal Distribution Workbook