


 596 / 762

596
Chapter 13: Confidence Intervals – Small Samples
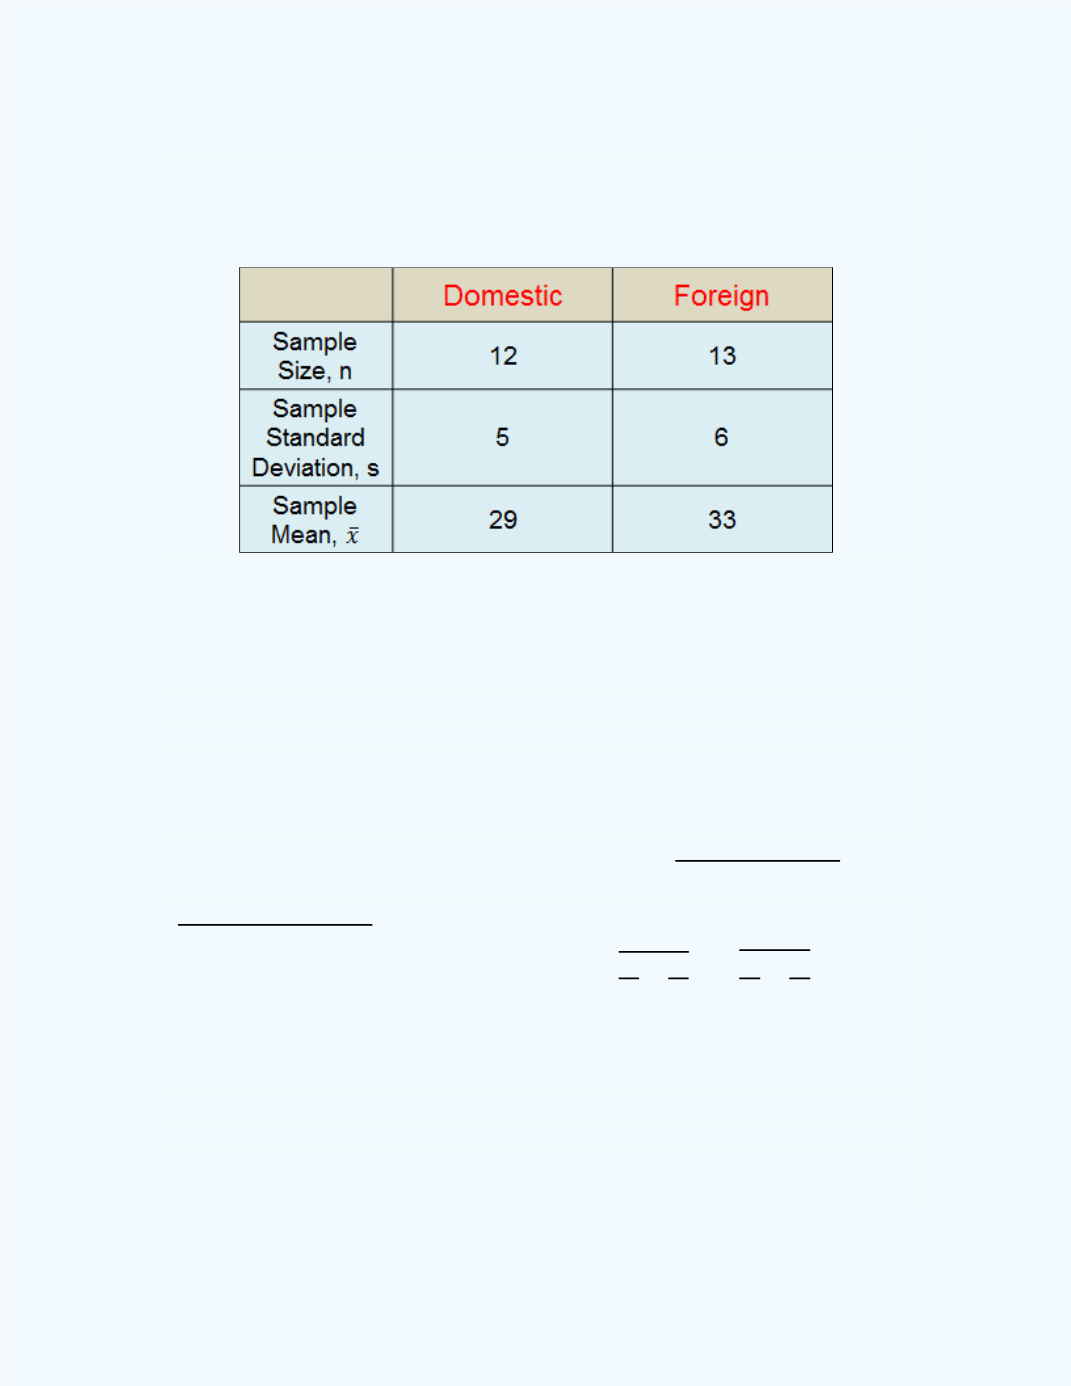
cars was selected for the experiment, with the summary results given in
Table 13-1
.
Table 13-1:
Summary information for
Example 13-5
Construct a 99% confidence interval for the difference in the mean miles per
gallon for the foreign minus the domestic cars. Assume normality for the
population distribution of the miles per gallon for both the domestic and
foreign cars and that these populations have equal variances.
Solution
:
Since we are considering (foreign – domestic) we will let
subscript 1be associated with the population of miles per gallon for the
foreign cars and subscript 2 be associated with the population of miles per
gallon for the domestic cars. Thus, from the information given, we have
= 13,
= 12,
̅
= 33,
̅
= 29,
= 6,
= 5,
(
)
(
)
=
( )
( )
= 30.7391,
= 5.5443,
= 0.01,
/2 = 0.005,
df
= 13 + 12 – 2 = 23,
= 2.8073, and
√
=
√
= 0.4003.
Thus, the 99 percent confidence interval estimate for the difference in the
mean miles per gallon for the foreign minus the domestic cars (foreign –
domestic) is (33 – 29)
2.8073
5.5443
0.4003 = 4
6.2305. That is, we
are 99 percent confident that the difference between the means for the two
populations (average for the foreign car mpg - average for the domestic car
mpg) is (-2.2305, 10.2305). That is, we are 99% confident that the