


 599 / 762

Chapter 13: Confidence Intervals – Small Samples
599
Solution
:
We will use the
Small Sample Confidence Interval for the
Difference between Two Independent Means
workbook to help with the
computations. In this way, we can forego all the tedious computations.
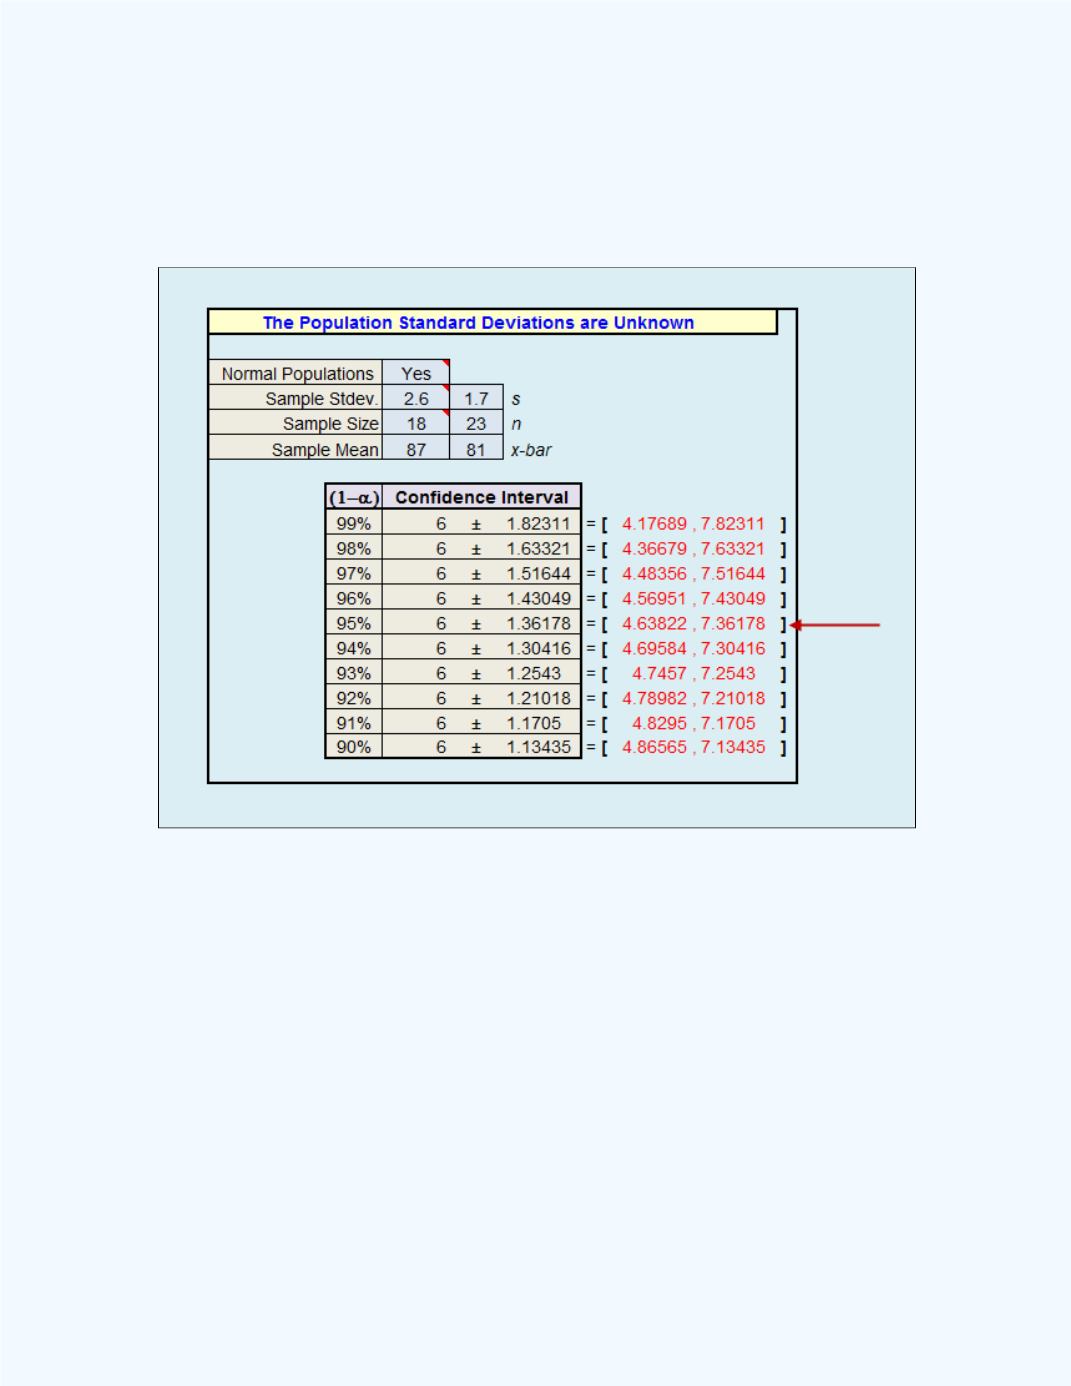
Figure 13-10
shows the workbook output for the problem.
Figure 13-10:
Workbook Output with the Confidence
Interval for
Example 13-6
Thus, the 95% confidence interval estimate for the difference of the means
for the two populations (average for Method 1 – average for the Method 2)
is (4.6382, 7.3618). This was obtained from the output in
Figure 13-10
.
That is, we are 95% confident that the difference between the two population
means will be between 4.6382and 7.3618. Thus, we can also say that the
average score for method 1 will be between 4.6382 and 7.3618 more than
that of method 2.
Since both limits for the interval are positive, one may conclude that
method 1 seems to be the better of the two methods.