


 601 / 762

Chapter 13: Confidence Intervals – Small Samples
601
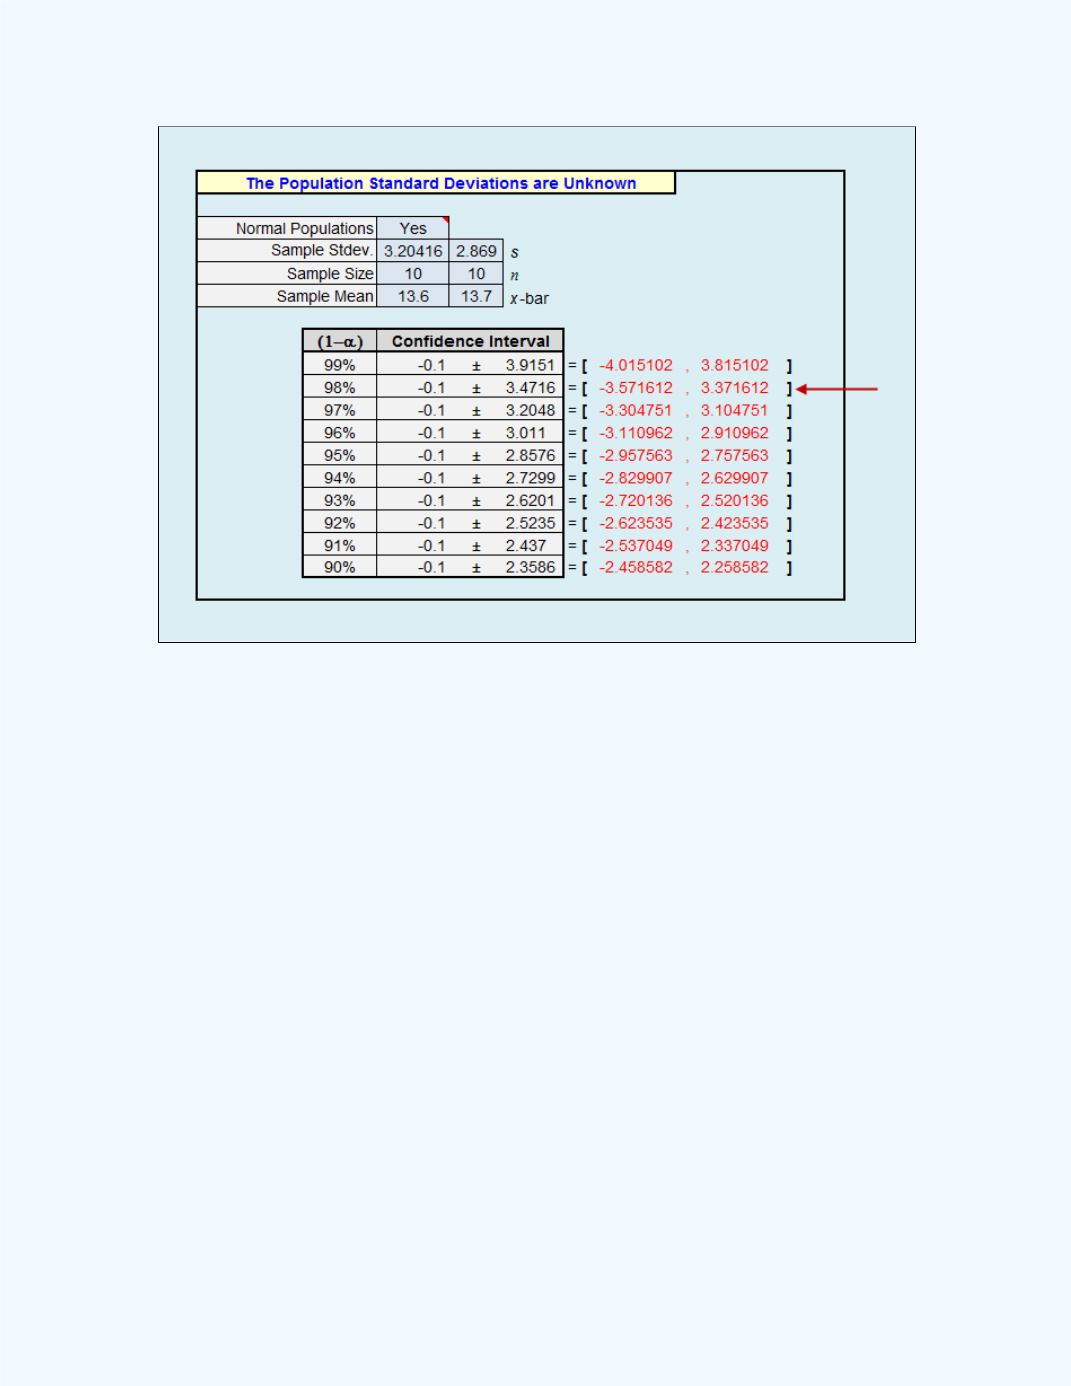
Figure 13-11:
Workbook Output with the Confidence
Interval for
Example 13-7
Thus, the 98% confidence interval estimate for the difference of the means
for the two populations (average for the male students - average for the
female students) is (-3.5716, 3.3716). This was obtained from the output in
Figure 13-11
.
That is, we are 98% confident that the difference between the mean time to
complete the project by the male and female students will be between
-3.5716 and 3.3716.
Observe that the lower limit of the interval is negative while the upper limit
is positive. Thus, zero is included in the interval. This would imply that we
cannot say that the means are significantly different since there is a
possibility of them being equal by the fact that zero is in the interval. That
is, based on the 98% confidence interval, the instructor may claim that the
female and male students, on average, will spend the same amount of time
on the project.