


 606 / 762

606
Chapter 13: Confidence Intervals – Small Samples
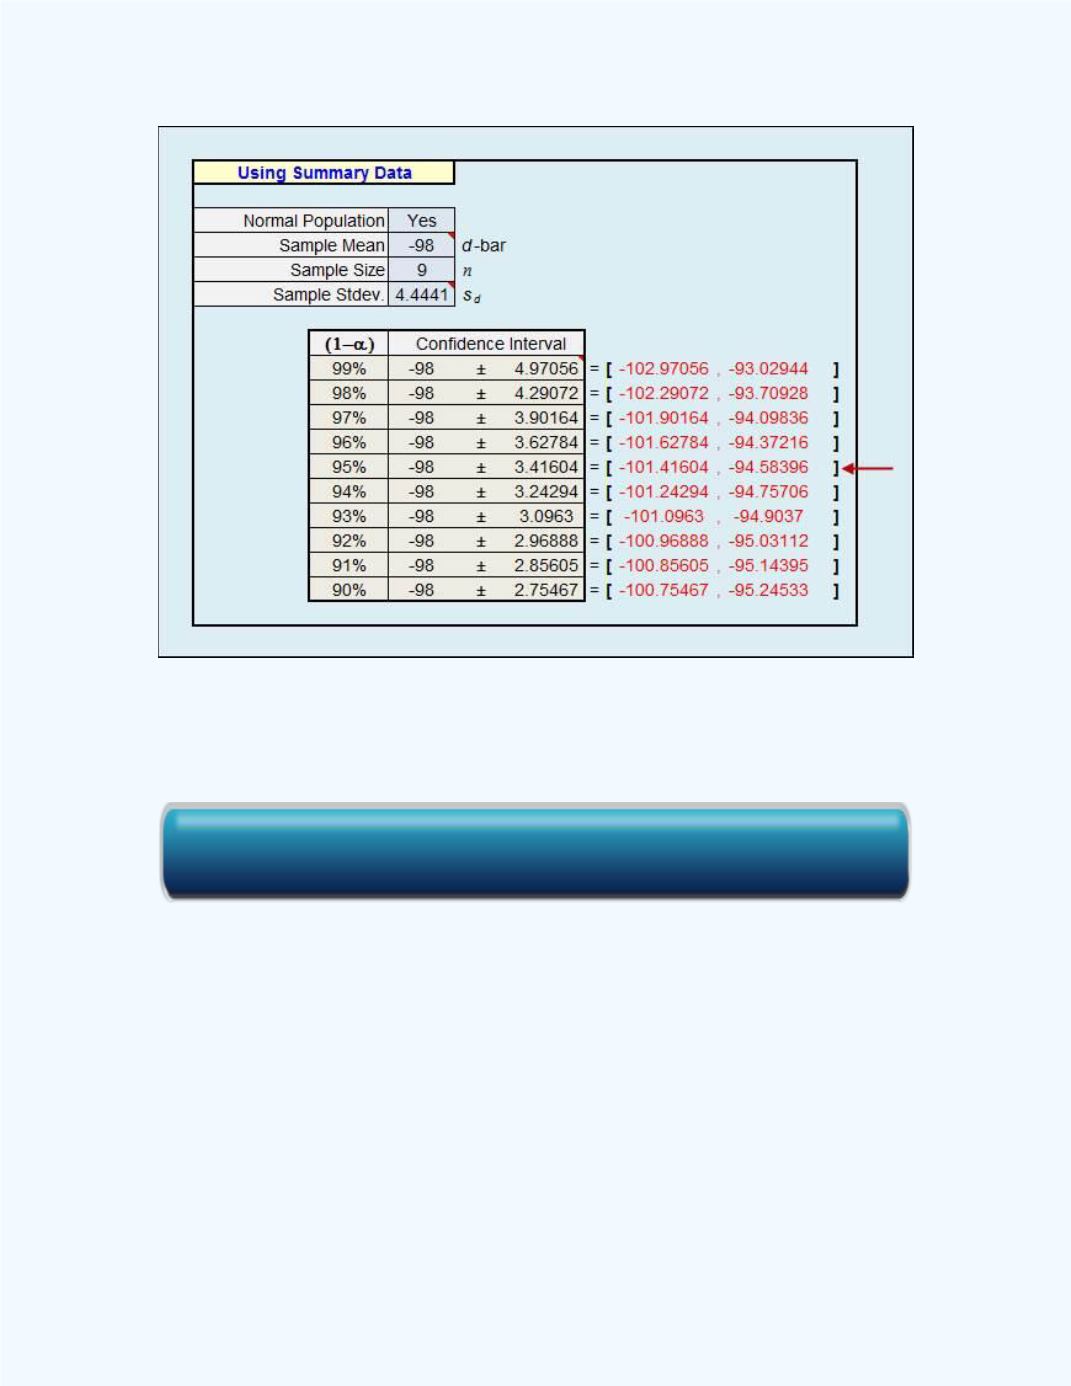
Figure 13-12:
Workbook Output with the Confidence
Interval for
Example 13-8
when the
summary information is used
Figure 13-13
shows the output when the data for the differences are used to
construct the confidence interval. From
Figure 13-13
, the computed 95%
confidence interval is (-100.4160, -94.5840) to four decimal places. These
were the same end points for the interval as those displayed in
Figure 13-12
.
Click here for the Small Sample Confidence Interval for a Single Population Mean Workbook