


 609 / 762

Chapter 13: Confidence Intervals – Small Samples
609
Since we are dealing with the before and the after scores for each student
then this data set will be a dependent set of data. Construct a 97 percent
confidence interval for this set of dependent data. Use the (after score –
before score) as the basis for the confidence interval.
Solution:
We can use any of the approaches we used to solve the problem
in
Example 13-8
. Here we choose to use the
Small Sample Confidence
Intervals for the Difference between Two Dependent Means
workbook to
directly compute the confidence interval. Note, since we would like to use
the (after score – before score) as the basis for the confidence interval, then
we will have to enter the values of the after scores as the Sample Data 1
values in the workbook
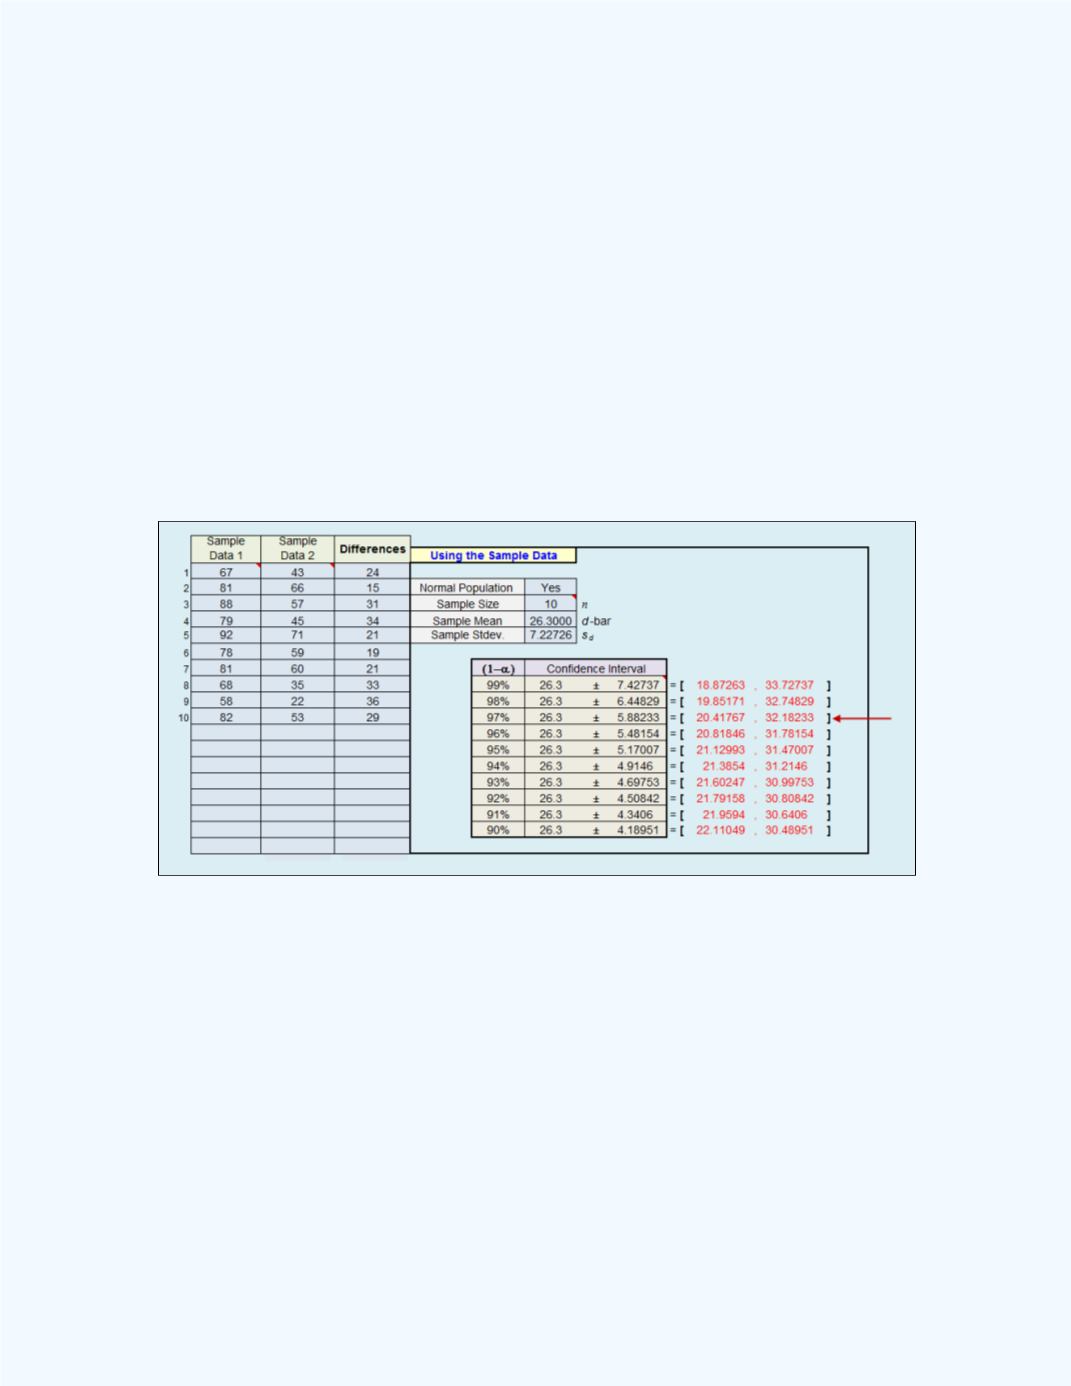
. Figure 13-15
shows the appropriate portion of the
workbook.
Figure 13-15:
Workbook Output with the Confidence
Interval for
Example 13-9
when both sets of
Data are used
From
Figure 13-15
, we see that the 97% confidence interval for the
difference in the means for the after scores minus the before scores is
(20.4177, 32.1823) correct to four decimal places. Observe that both end
points for the interval are positive. This would suggest that the average of
the after scores is larger than the average of the before scores. This would
also possibly suggest that the remediation may have helped the students to
re-discover or to re-learn or to learn the presented materials to improve their
basic math skills.