


 604 / 762

604
Chapter 13: Confidence Intervals – Small Samples
where,
Note:
The degrees of freedom
df
for the
t
-distribution is
n –
1, where
n
is the
number of pairs or the number of differences in the resulting set.
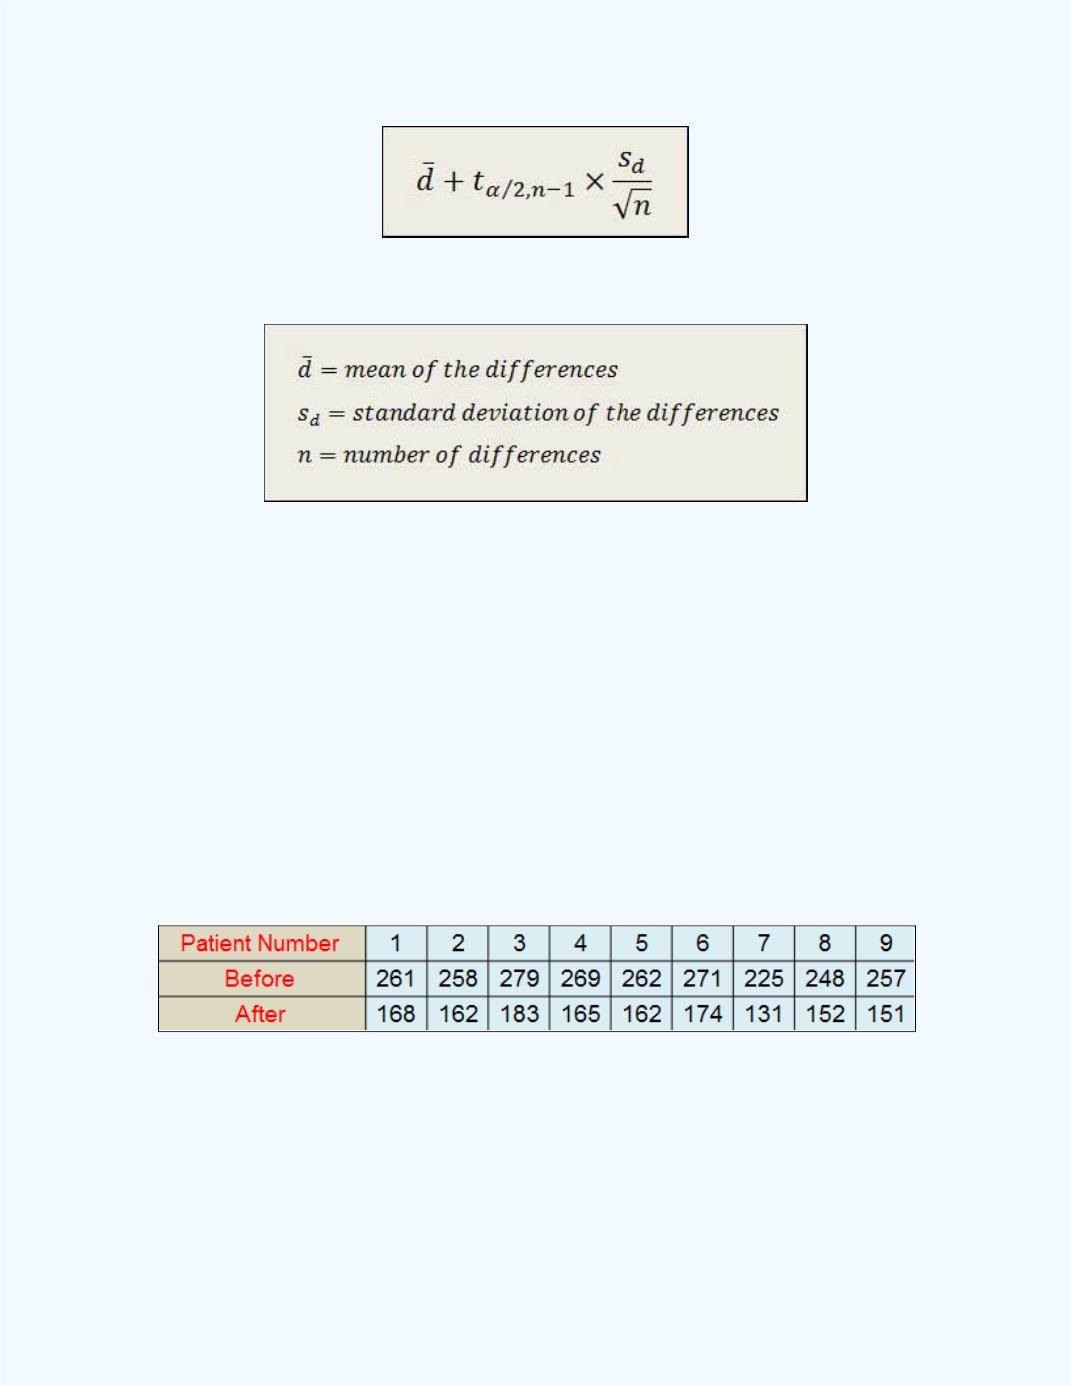
Example 13-8:
A dietitian wanted to measure the weight loss for nine male
patients who were undergoing a weight loss program. The patients were
weighed at the beginning of the program and the weights were recorded. At
the end of the weight loss program, the patients were again weighed and
weights were recorded.
Table 13-4
shows the before-and-after measured weights, in pounds, for the
nine patients.
Table 13-4:
The Before and After Weights
Construct a 95% confidence interval for this set of dependent data to
determine whether the diet program was effective in reducing the weights of
the patients.
Solution:
Since we would like to determine whether the program was
effective in reducing the weights of the patients, it would be convenient to