


 608 / 762

608
Chapter 13: Confidence Intervals – Small Samples
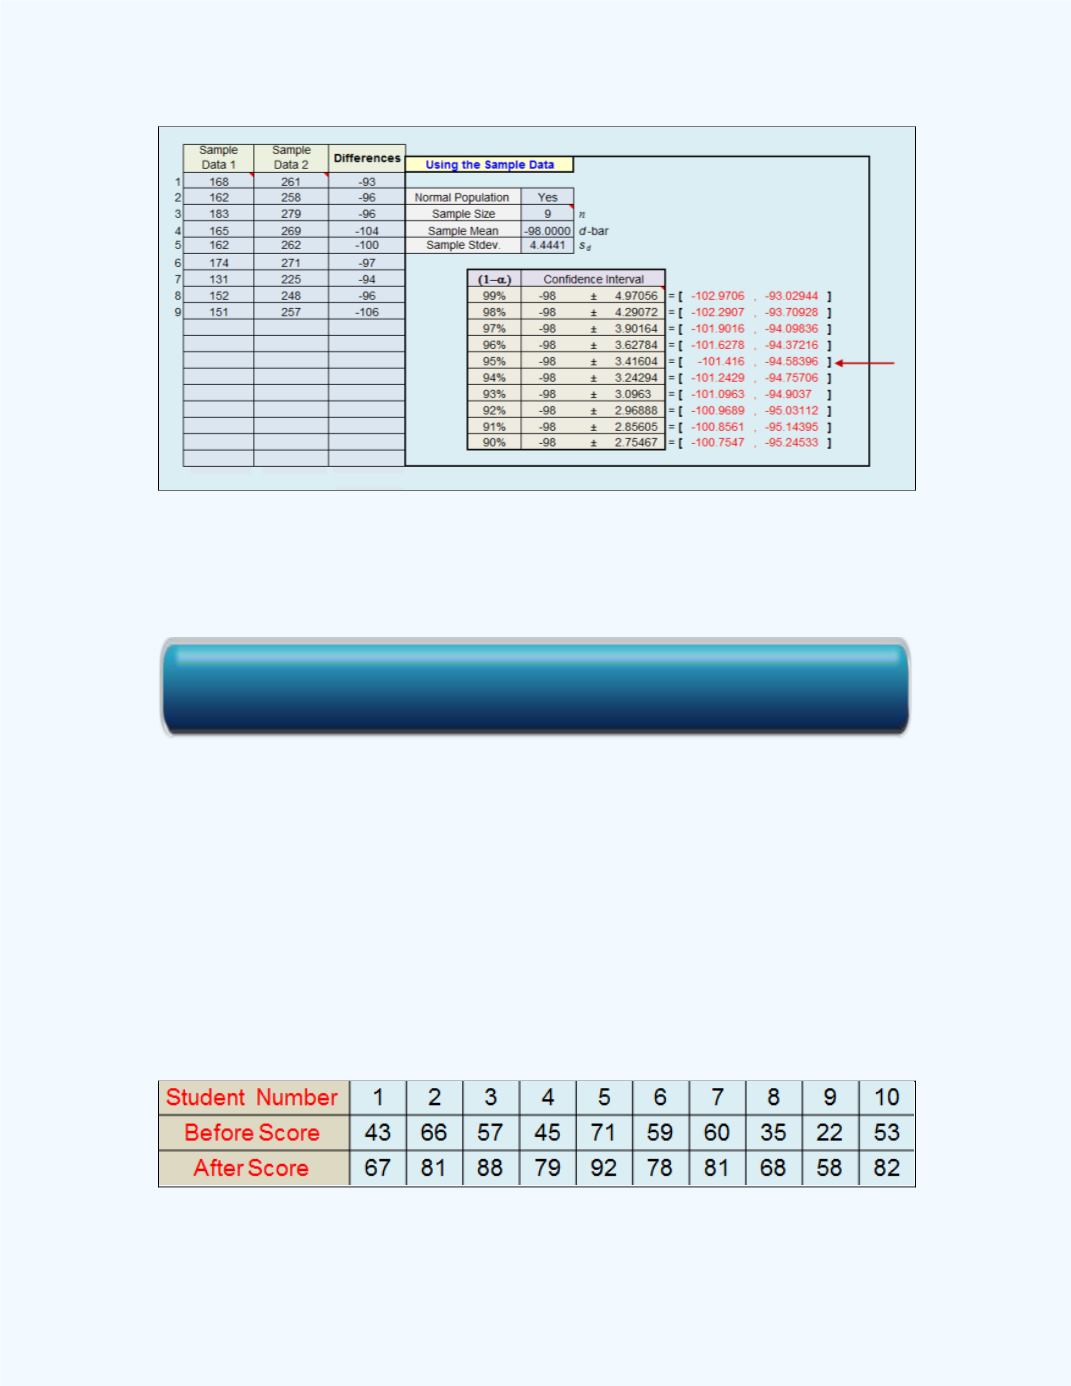
Figure 13-14:
Workbook Output with the Confidence
Interval for
Example 13-8
when both sets of
Data are used
Example 13-9:
An instructor wanted to measure the basic math skills of a
group of very non-traditional students before and after a period of
remediation in basic mathematics. A skills test was administered at the
beginning of the semester, and the scores recorded. At the end of the
semester, he administered the same test and recorded their scores.
Table 13-6
shows the before-and-after scores for the test for the students
who remained in the course until the end of the semester. The maximum
possible score on the test was 100 points.
Table 13-6:
Before and After Scores
Click here for the Small Sample Confidence Interval for the Difference Between Two Dependent Means Workbook