


 616 / 762

616
Chapter 14: Hypothesis Tests – Small Samples
Note
: We can also use the
Small Sample Test for a Single Population
Mean
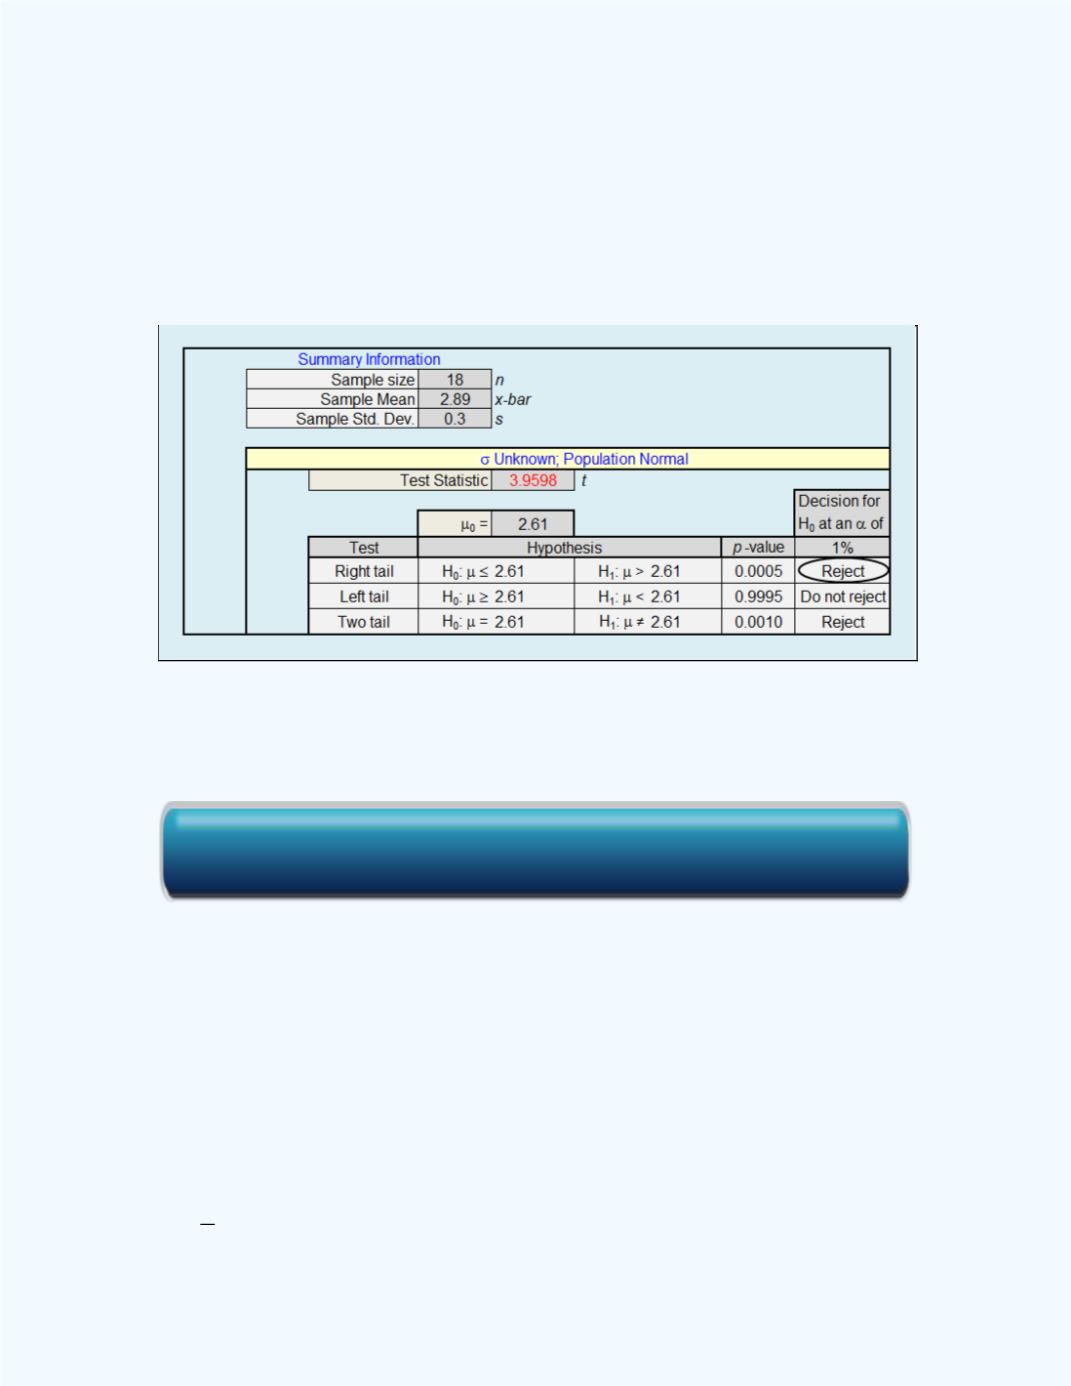
workbook to help with the computation for this example. The output
is given in
Figure14-3
. It shows that the
P
-value = 0.0005 <
= 0.05 (5%)
so the null hypothesis will also be rejected and one will have the same
conclusion as when the classical approachwas used.
Figure 14- 3
: Display of the Small Sample Test for a Single
Population Mean workbook output for
Example14-1
Example 14 -2
: In a study of Vietnam Veterans’ possible genetic damage
due to exposure to Agent Orange, the Sister Chromatid Exchange (SCE)
assay was used to determine damage. The mean SCE was found to be 8.24
among a control group of participants. The obvious hypothesis is that the
mean SCE will be greater among the veterans. A random sample of 24 of
the veterans yielded a mean SCE of 10.99 with a standard deviation of 3.05.
Test the hypothesis at the 5% level of significance.
Summary Information
:
= 24,
= 24 – 1 = 23,
= 3.05,
= 0.05,
̅
(sample mean) = 10.99,
=
= 1.7139, and
= 8.24. Also,
√ ⁄
= 0.6226.
Click here for the Small Sample Test for a Single Population Mean Workbook