


 622 / 762

622
Chapter 14: Hypothesis Tests – Small Samples
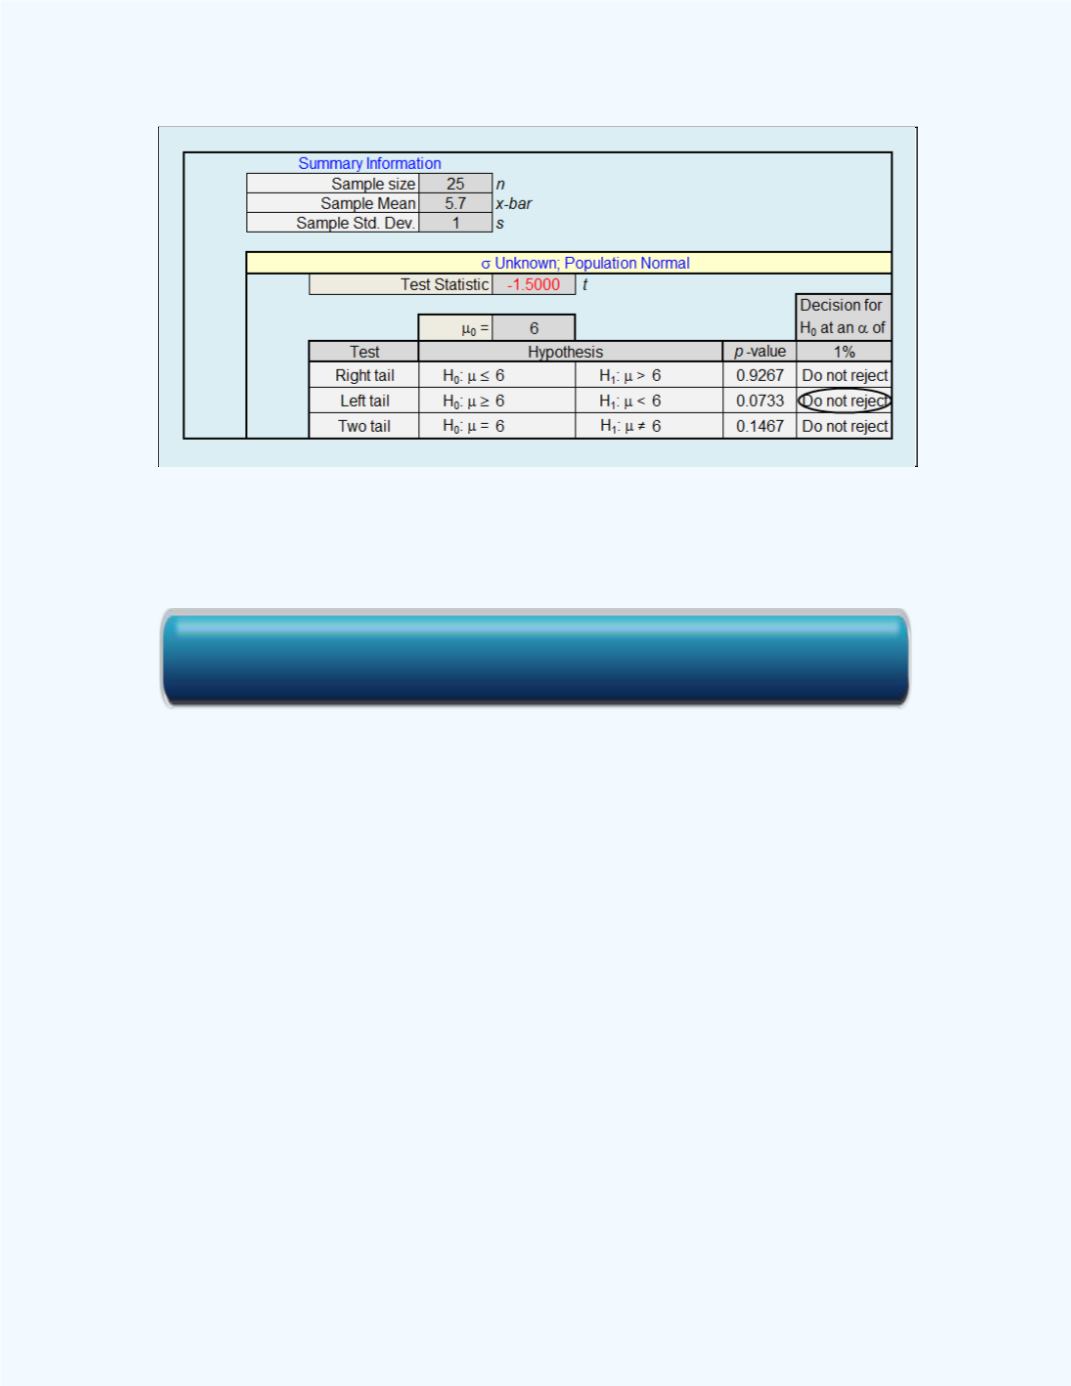
Figure 14-7
: Display of the Small Sample Test for a Single
Population Mean workbook output for
Example14-3
Example 14 -4
: A local union would like to establish that the average
annual salary for similar workers who they represent in a particular state is
less than $45,500. A random sample of 26 similar workers, not represented
by the union in the state, produced a mean salary of $43,800 with a standard
deviation of $3,275. Use the
P
-value approach to test the union’s claim at
the 1% level of significance.
Summary Information
:
= 26,
= 3,275,
= 0.01,
̅
(sample mean) =
43,800, and
= 45,500.
Since the union would like to establish that the average salary is less than
$45,500, this will be a left-tailed test.
Also, since we are asked to use the
P
-value approach, then we will use the
workbook to help with the computation of the
P
-value. The
Small Sample
Test for a Single PopulationMean
workbook output is shown in
Figure
14-8
.
Click here for the Small Sample Test for a Single Population Mean Workbook