


 621 / 762

Chapter 14: Hypothesis Tests – Small Samples
621
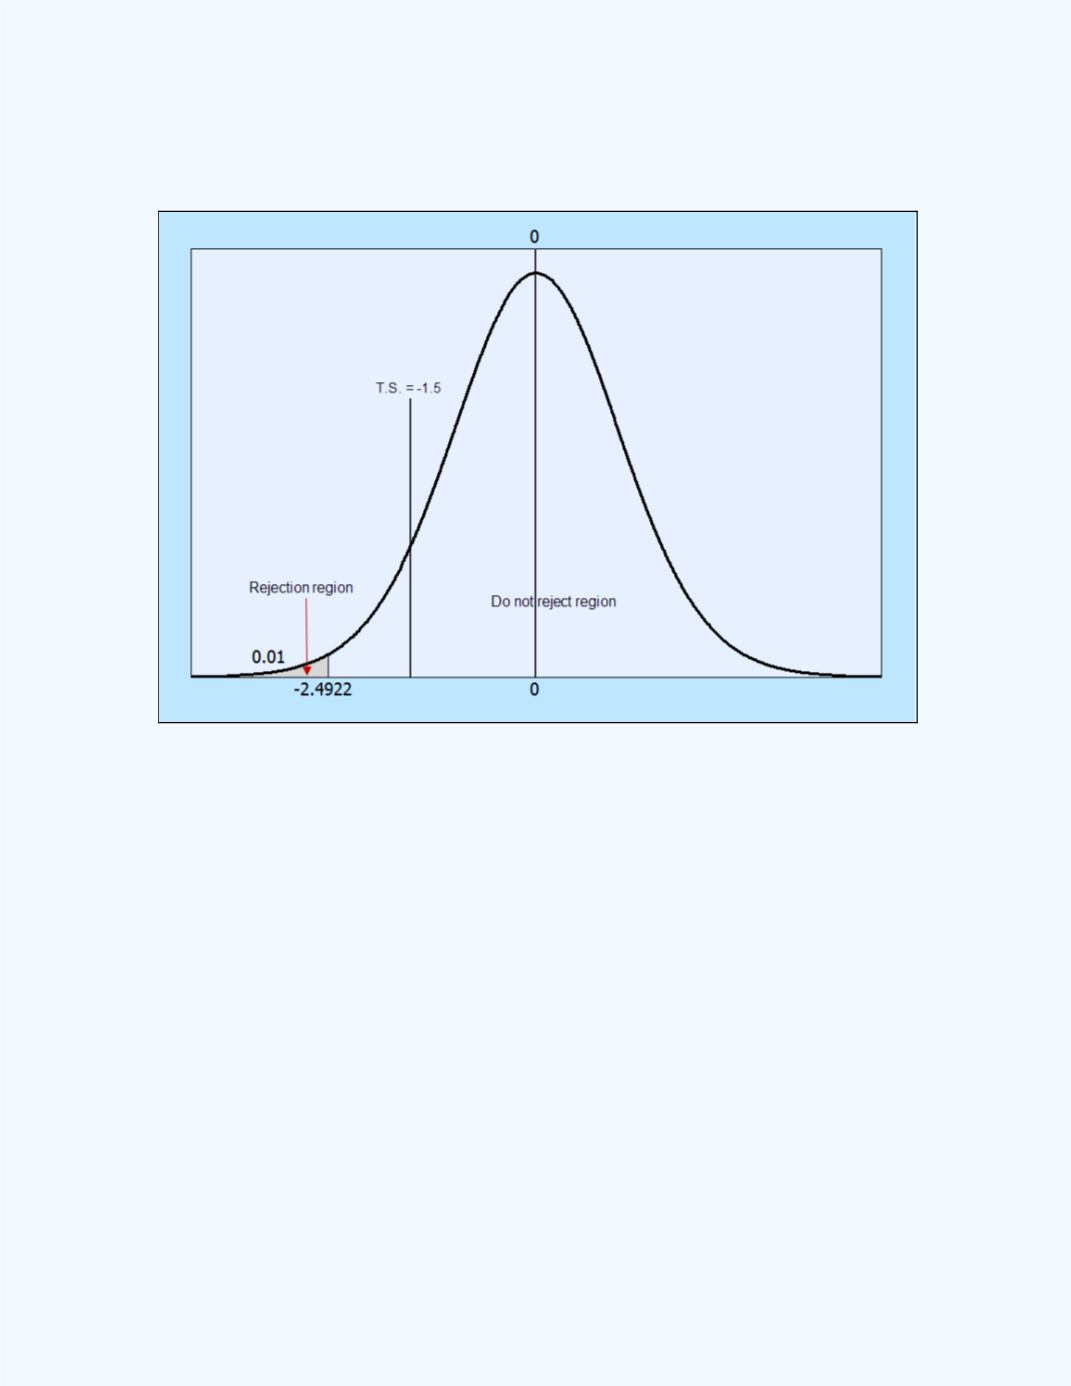
Figure 14-6
displays the test statistic in relation to the rejection region.
Observe that the test statistic falls in the do not reject region.
Figure 14-6:
Display of the test statistic in relation to the
rejection region for
Example 14-3
Note
: We can also use the
Small Sample Test for a Single Population
Mean
workbook to help with the computation for this example.
The output is given in
Figure 14-7
. It shows that the
P
-value = 0.0733 >
= 0.01 (1%) so the null hypothesis will not be rejected and one will have the
same conclusion.