


 632 / 762

632
Chapter 14: Hypothesis Tests – Small Samples
Example 14 -6
: “
With the
National Retail Federationestimating that the
average family will spend $669.28 on clothes, shoes, supplies and
electronics, more retailers are clamoring for a share of those sales. That's
up 5 percent
from last year's $634.78,but still shy of
2012's high of $688.62.For students heading to college, that average balloons to $916.48 per family,
up 10 percent from $836.83 last year, for things like dorm furniture,
bedding, school supplies, electronics and other comforts.”
Source:
http://www.cleveland.com/business/index.ssf/2014/07/raise_your_hand_if_yo ure_ready_for_back-to- school_shopping_average_costs_up_5_to_669_per_family.htmlHaving viewed this web site and read the article, a student would like to
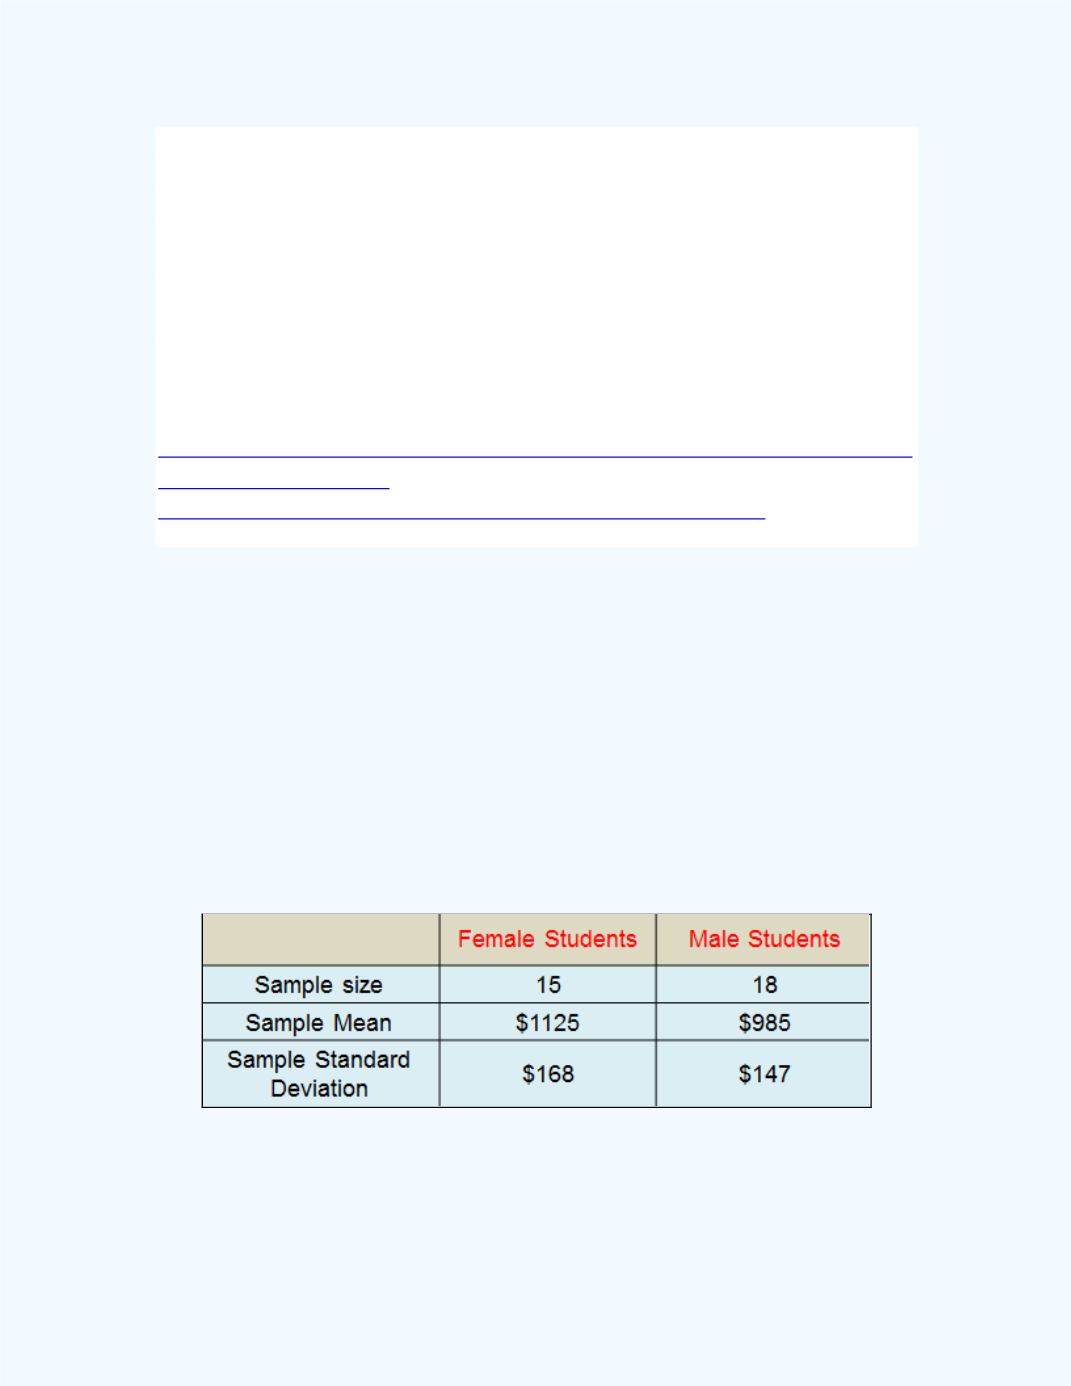
establish that on average, that female college students spend more than male
students on shopping at the beginning of the semester in her statistics course.
Table 14-1
shows the summary results of the study done by the student for a
sample of male and female students.
Assume that the distributions for both groups of the amount of money spent
at the beginning of the semester are normally distributed.
Table 14-1
: Data for
Example 14-6
Test at the 1% significance level.