


 638 / 762

638
Chapter 14: Hypothesis Tests – Small Samples
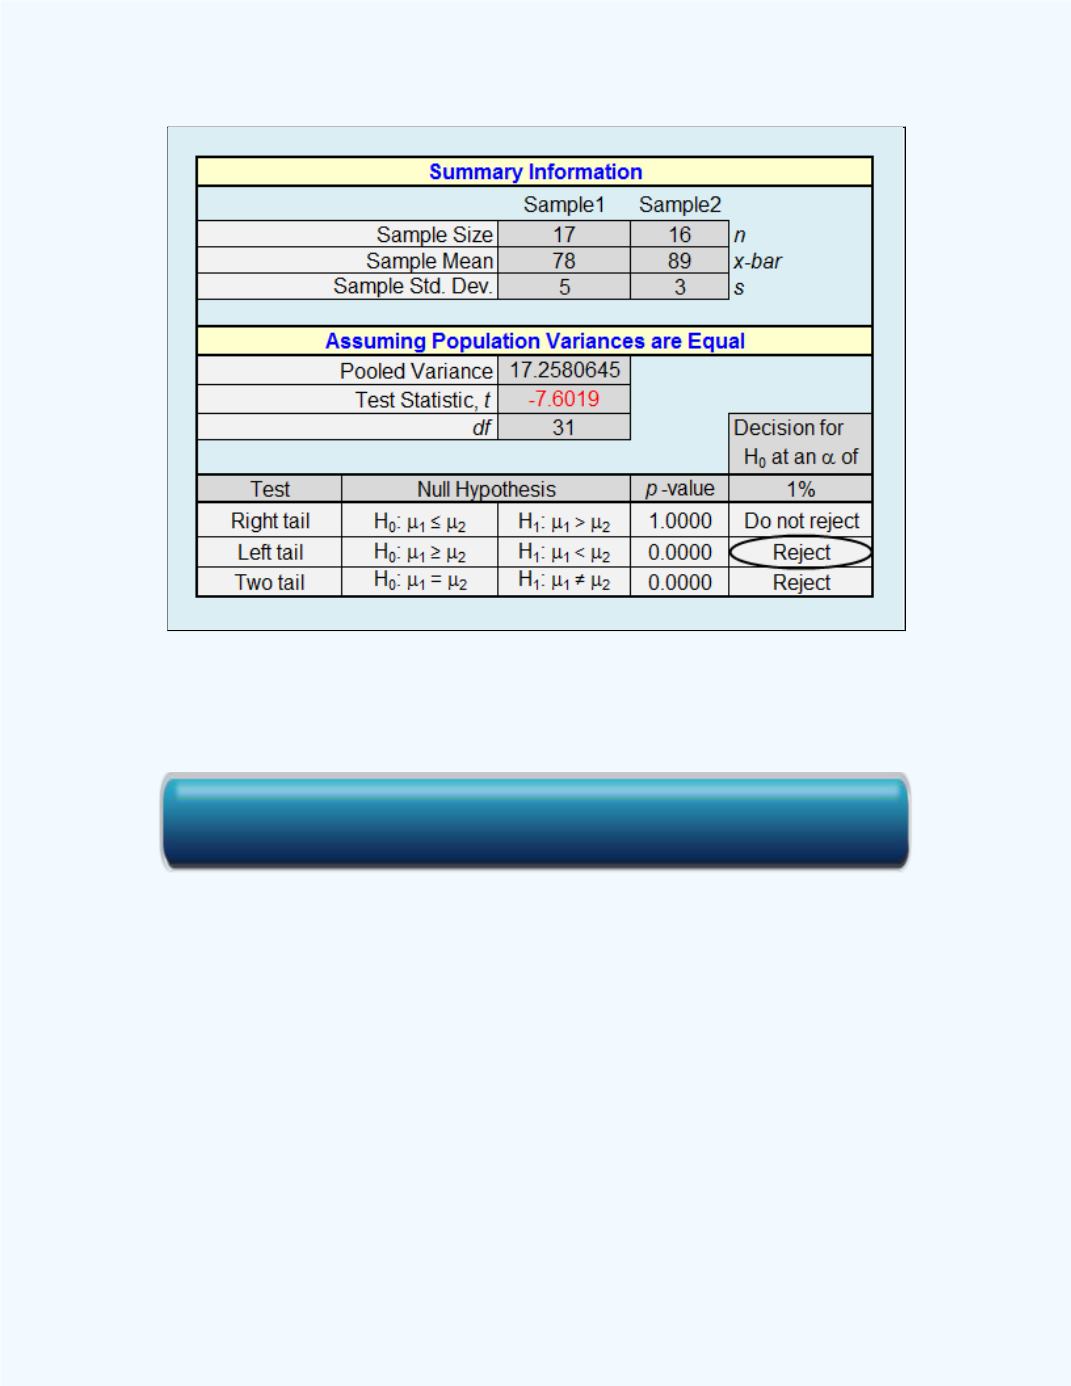
Figure 14-15
: Display of the Small Sample Test for the
Difference between Two Means workbook
output for
Example 14-7
Observe from the output that we are given both the
t
test statistic value and
the
P
-value for the test. Thus we can use the information to present the test
from the classical as well the
P
-value approach. We will present only from
the perspective of the
P
-value since the question required that approach.
P
-Value Approach
:
(
)
:
(
)
P
-value = 0.0000 (from
Figure 14-15
)
Click here for the Small Sample Test for the Difference Between Two Means Workbook