


 642 / 762

642
Chapter 14: Hypothesis Tests – Small Samples
Conclusion
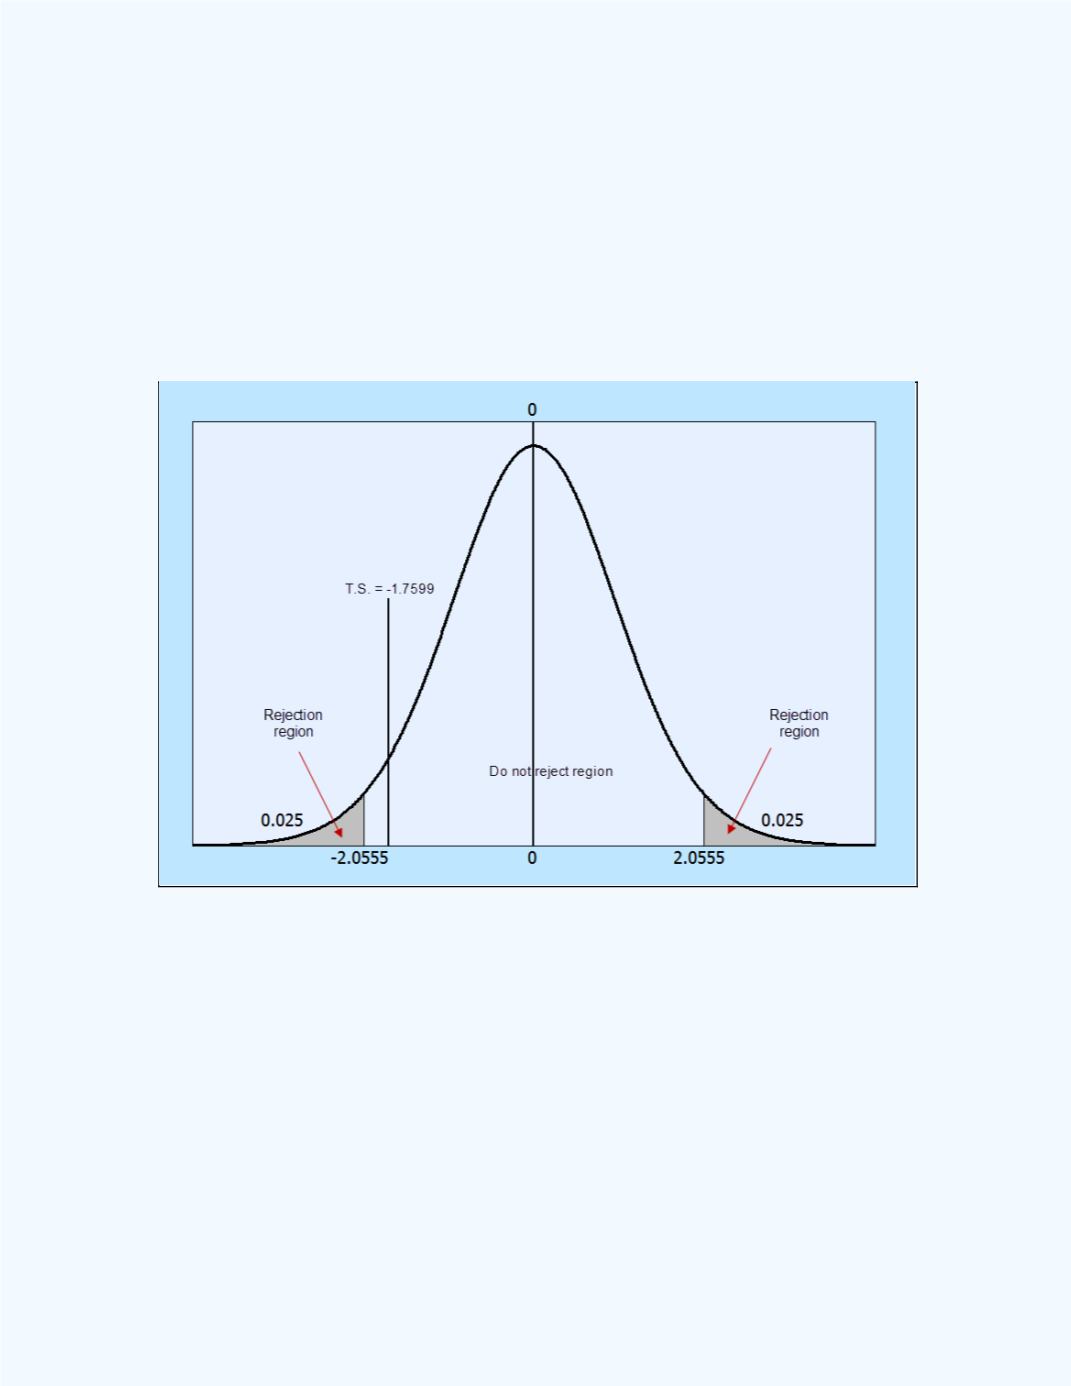
: Since 1.7599 < 2.0555, do not reject the null hypothesis. That
is, there is not a significant difference between the two normal population
means at the 5% level of significance.
Also, the
P
-value = 0.09202 >
= 0.05, so the same conclusion will result.
Figure 14-18
shows the test statistic value in relation to the rejection region.
Observe that the test statistic value falls in the do not reject region.
Figure 14-18:
Display of the test statistic in relation to the
rejection region for
Example 14-8
Example 14-9
:Two different medications were used to determine the
effectiveness of reducing a pain level five toothache. As patients reported to
a particular dentist with a toothache assessed to be at a level five, each
patient was given an equal dosage of one of the two medications, but not
both. The time it took for the pain level to reduce to zero (no toothache)
were recorded. The data for ten patients for each medication is given in
Table 14-3
.