


 639 / 762

Chapter 14: Hypothesis Tests – Small Samples
639
D.R
: For a significance level
= 0.01, reject the null hypothesis if the
computed
P
-value = 0.0000 <
= 0.01.
Conclusion
: Since 0.0000 < 0.01, reject
. There is sufficient sample
evidence to conclude that the average score using Method A is less than the
average score using Method B, at the 1% level of significance.
Note:
There is a significant differentiation for the difference between the
sample means and the postulated value of 0.
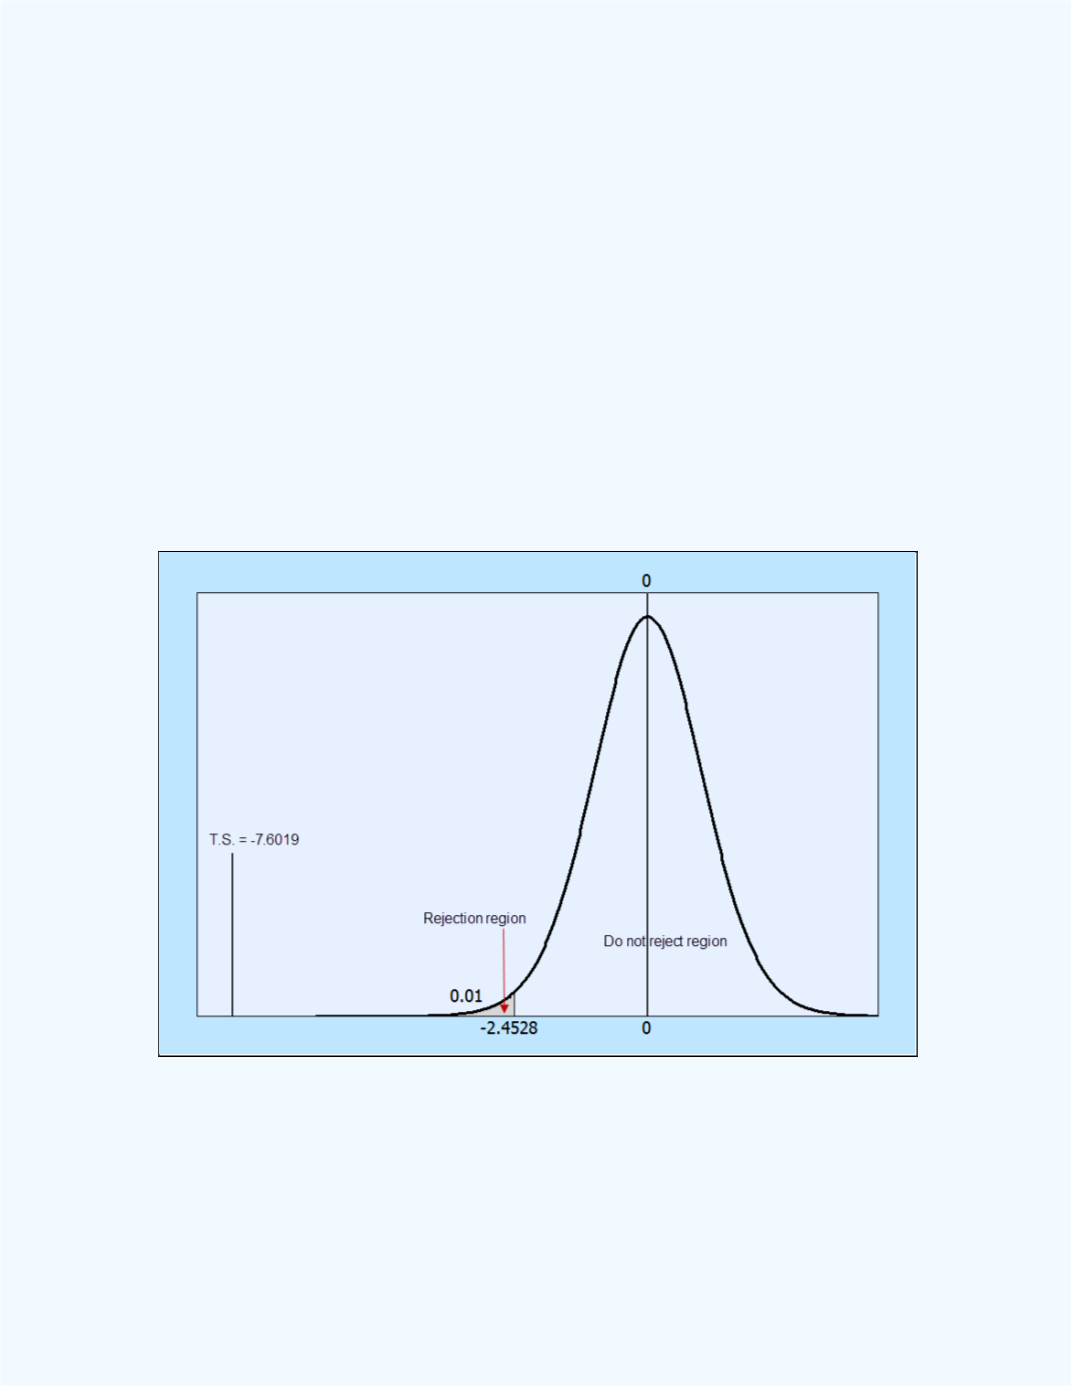
Figure 14-16
shows the test statistic value in relation to the rejection region.
Observe that the test statistic value falls way to the left in the rejection
region and as such, the
P
-value, which is the area to the left of the test
statistic value, is practically equal to zero.
Figure 14-16:
Display of the test statistic in relation to the
rejection region for
Example 14-7
(c) Two –tailed Test
The subscripts 1 and 2 are used to represent population 1 and