


 635 / 762

Chapter 14: Hypothesis Tests – Small Samples
635
Figure 14-13
: Display of the Critical
t-
value
for
Example 14-6
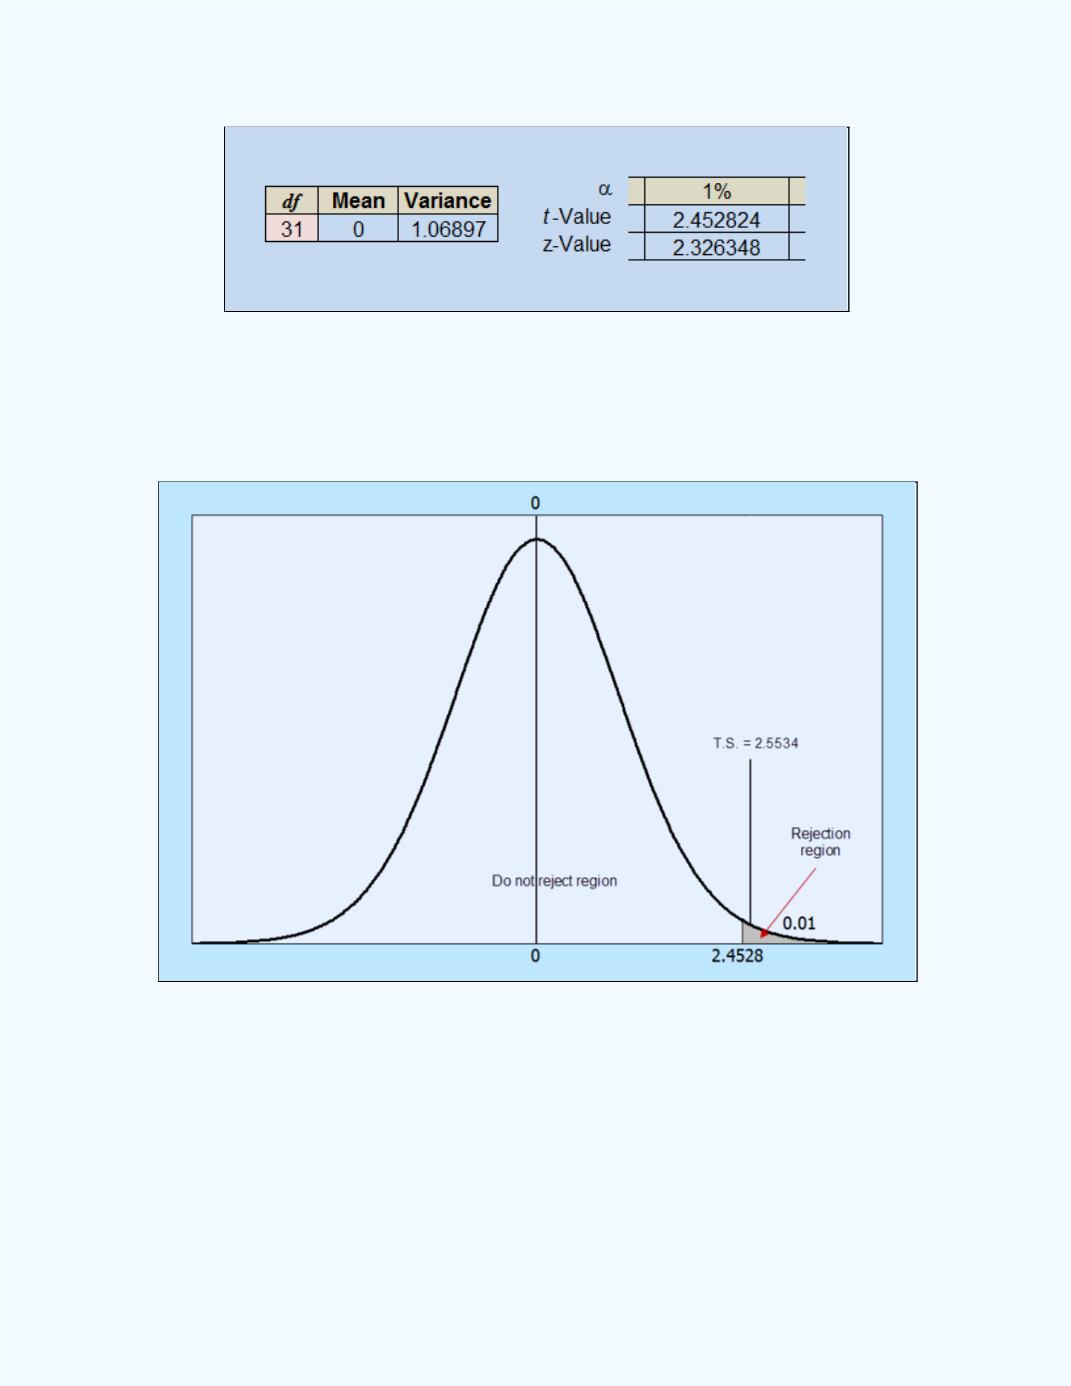
Figure 14-14
shows the test statistic value in relation to the rejection region.
Observe that the test statistic value falls in the rejection region.
Figure 14-14:
Display of the test statistic in relation to the
rejection region for
Example 14-6
Next we will present the
P
-value approach solution for
Example14-6
.
P
-Value Approach
:
(
)