


 645 / 762

Chapter 14: Hypothesis Tests – Small Samples
645
Conclusion
: Since 0.1805 > 0.05, do not reject the null hypothesis. That is,
there is not a statistical significant difference between the average times at
the 5% level of significance. That is, both medications seem to have similar
effect in reducing the pain level of the toothache and so neither one of them
would have an advantage in reducing the pain level to zero.
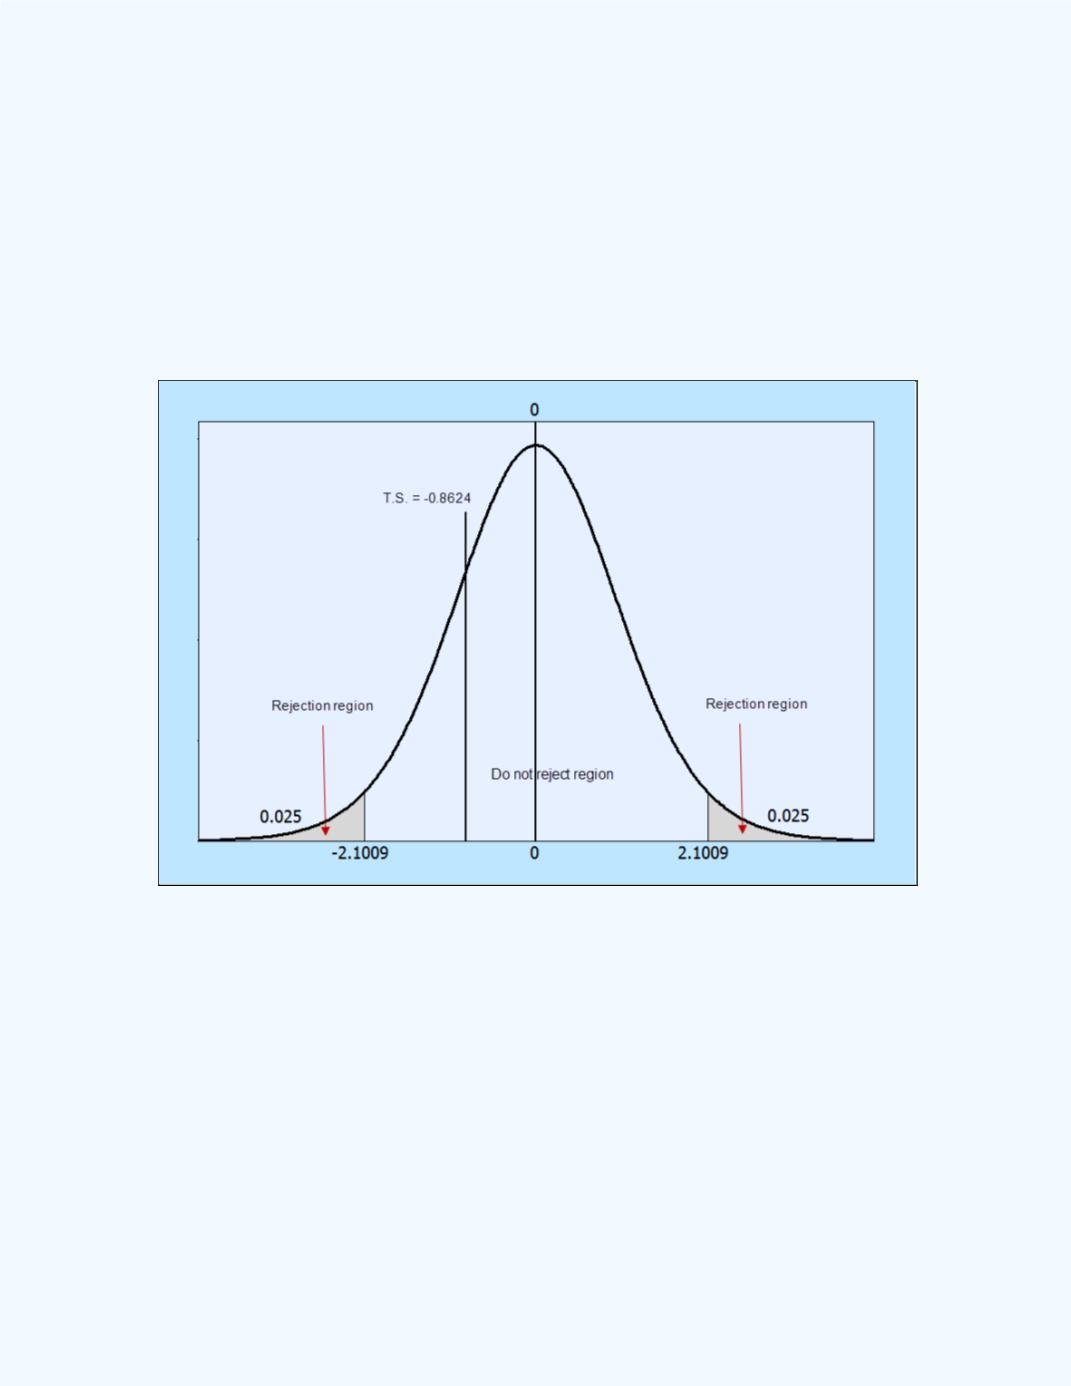
Figure 14-20
shows the test statistic value in relation to the rejection region.
Observe that the test statistic value falls in the do not reject region.
Figure 14-20:
Display of the test statistic in relation to the
Rejection region for
Example 14-9
Figure 14-21
shows the 95% confidence interval for the difference between
the two population means. Observe that the 95% confidence interval (we are
allowing for a 5% error) for the difference of the two population means is -
5.1254 to 1.0668 to four decimal places.
Now, since the interval ranges from a negative value to a positive value and
so includes the value of zero, one may also conclude that there is not a
significant difference between the average times. That is, both medications