


 650 / 762

650
Chapter 14: Hypothesis Tests – Small Samples
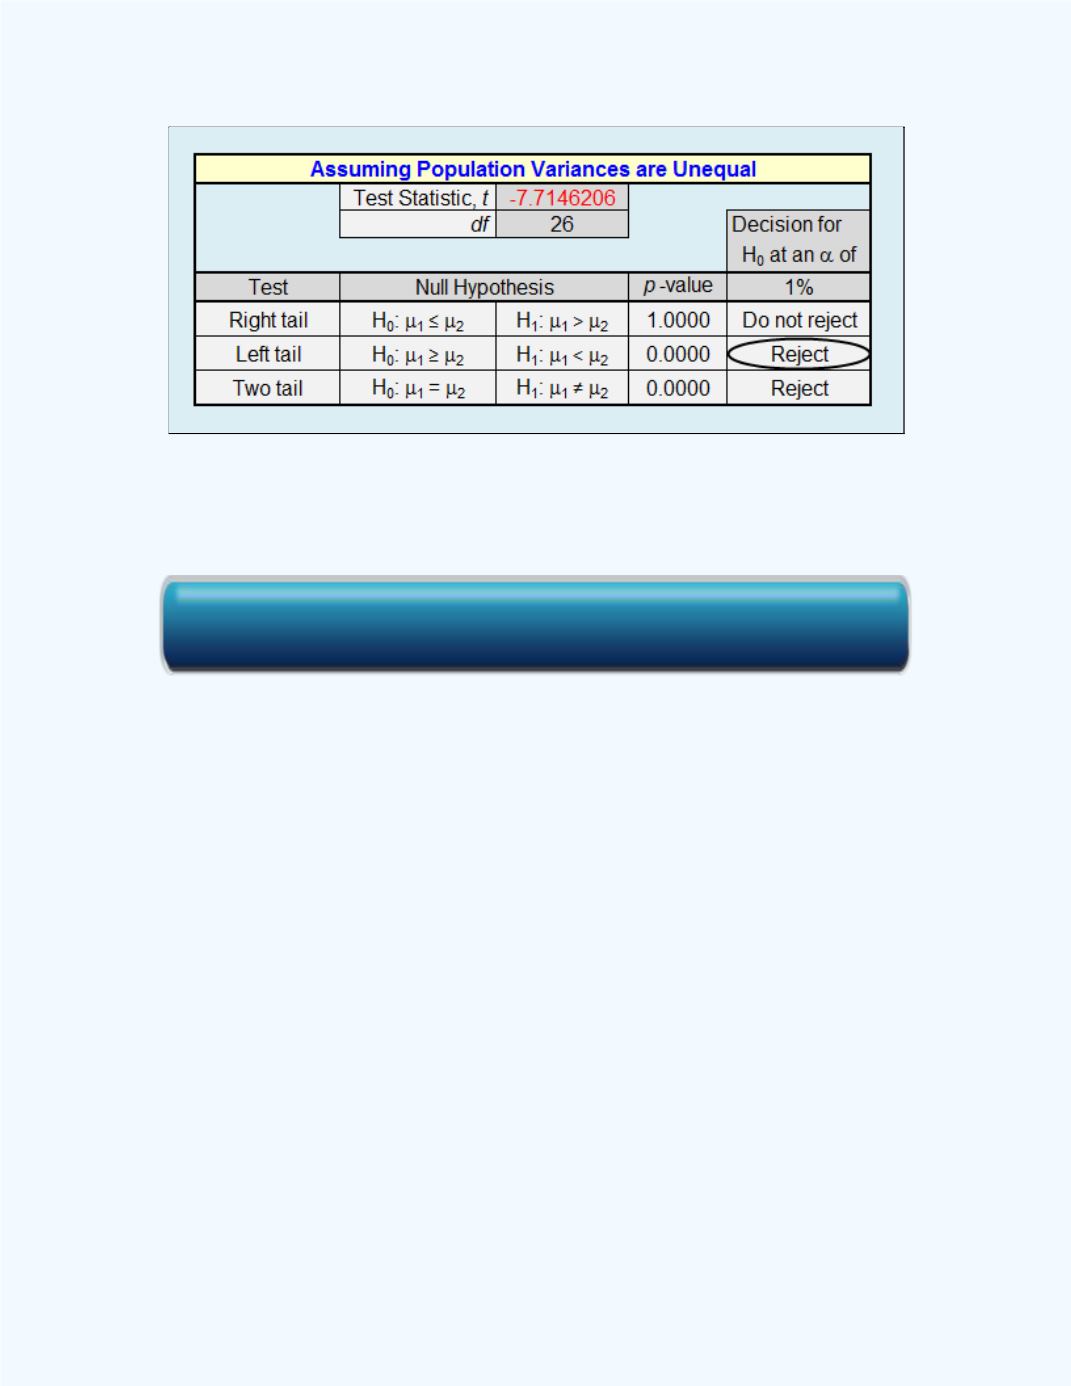
Figure 14-23
: Display of the Small Sample Test for the
Difference between Two Means workbook
output for
Example 14-11
We will use the output information in
Figure 14-23
to write up the
hypothesis test from a
P
-value approach.
:
(
)
(
)
P
-value = 0.0000 (from
Figure 14-23
)
For
a significance level
= 0.01, reject the null hypothesis if the
computed
P
-value = 0.0000 <
= 0.01.
Conclusion
: Since 0.0000 < 0.01, reject
. There is sufficient sample
evidence to conclude that the average score using Method A is less than the
average score using Method B, at the 5% level of significance. This is the
same conclusion as when the variances were assumed to be equal.
Note:
There is a significant differentiation for the difference between the
sample means of 78 – 89 = -9 and the postulated value of 0.
Click here for the Small Sample Test for the Difference Between Two Means Workbook