


 648 / 762

648
Chapter 14: Hypothesis Tests – Small Samples
Difference betweenTwo Independent Means
workbook to help with the
computations.
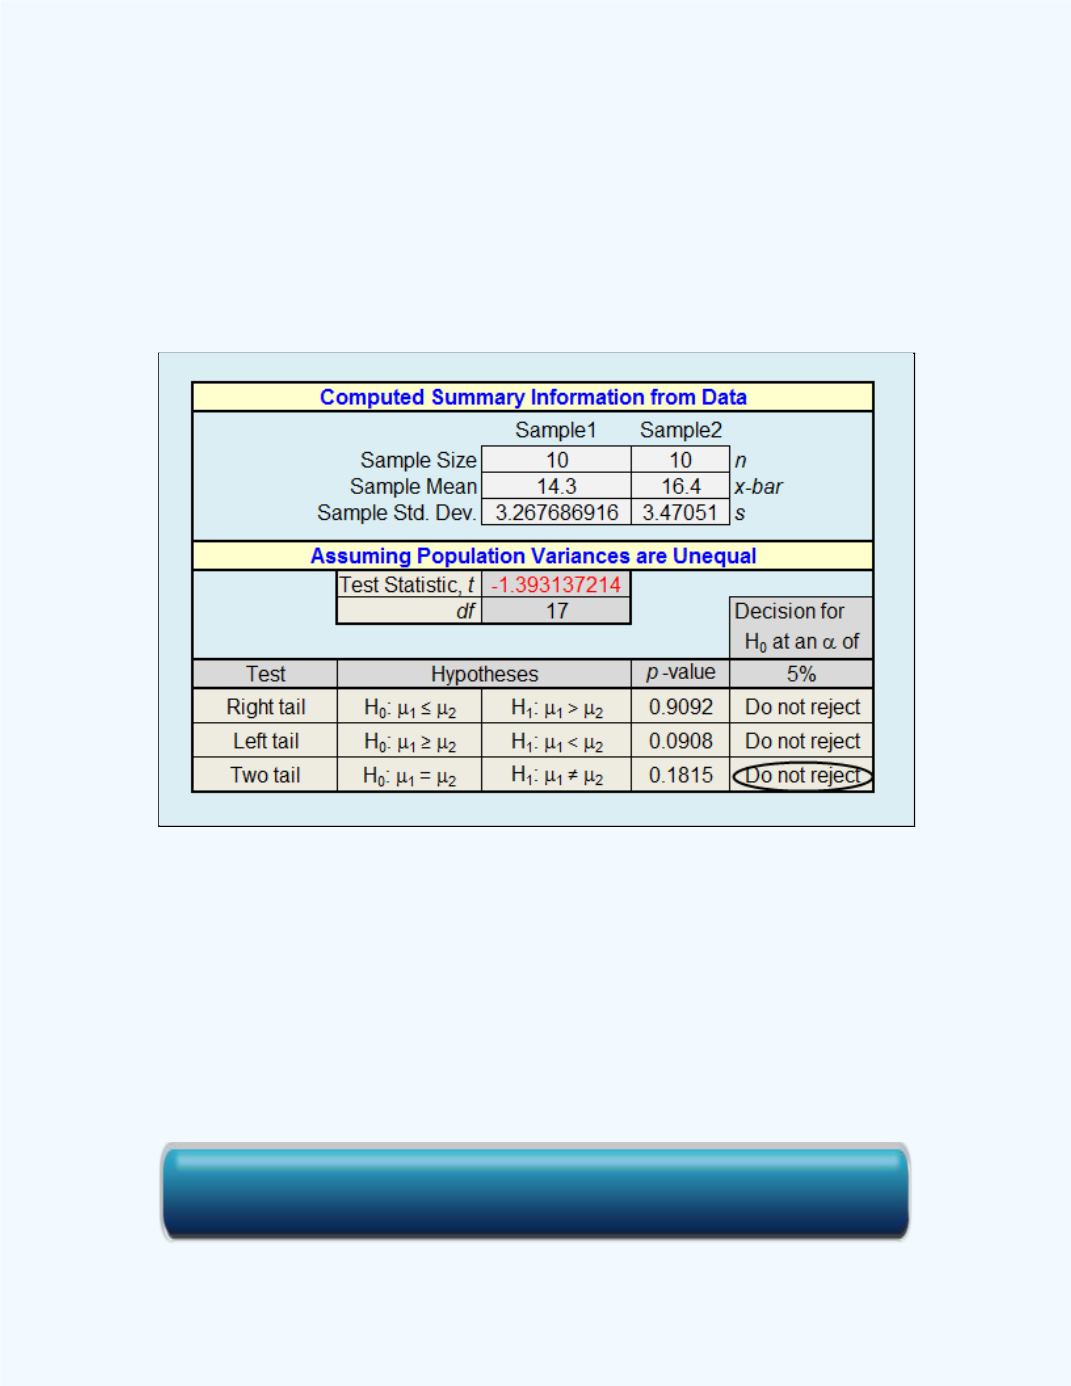
The workbook accommodates for both cases of equal and unequal variances.
The appropriate portion of the workbookwhich deals with testing for the
difference between two population means when the variances are unequal is
shown in
Figure 14-22
.
Figure 14-22
: Display of the Small Sample Test for the
Difference between Two Means workbook
output for
Example 14-10
Observe that the
P
-value for the two-tailed test is 0.4005 so you will fail to
reject the null hypothesis at the 5% level of significance since 0.4005 > 0.05.
That is, there is not a statistical significant difference between the average
times for the two different medications in reducing the pain level of the
toothache.
Click here for the Small Sample Test for the Difference Between Two Means Workbook