


 651 / 762

Chapter 14: Hypothesis Tests – Small Samples
651
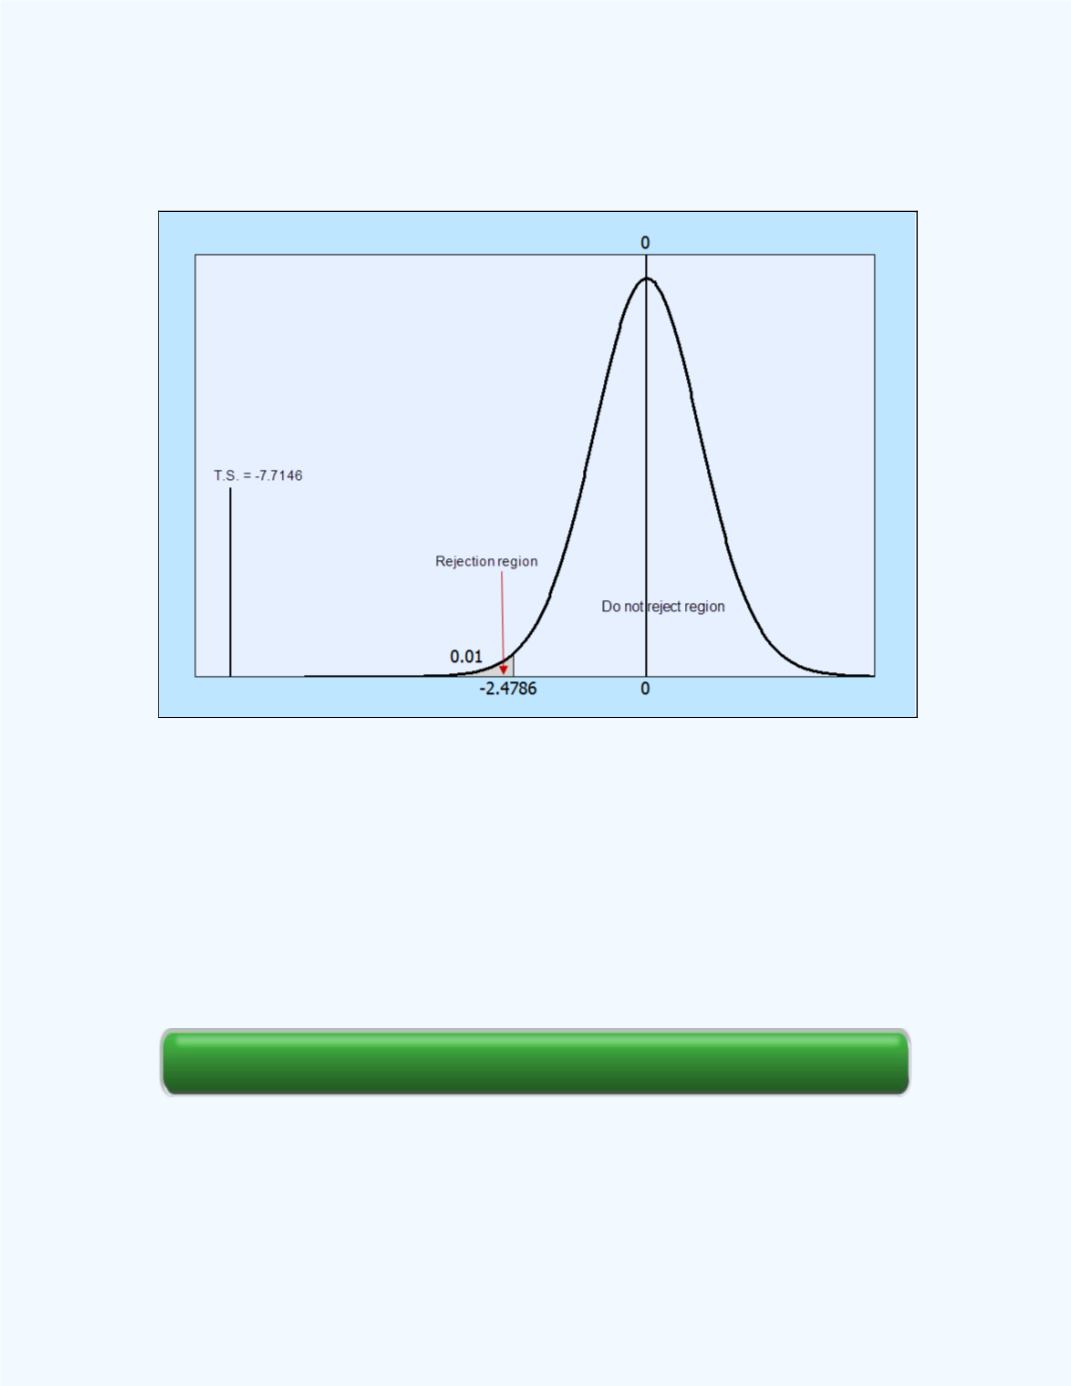
Figure 14-24
shows the test statistic value in relation to the rejection region.
Observe that the computed
t
test statistic falls in the rejection region.
Figure 14-24:
Display of the test statistic in relation to the
Rejection region for
Example 14-11
Next we will discuss tests for the difference between two population means
when we have dependent samples.
Section Review
e-Self Review