


 709 / 762

Chapter 16: One-Way Analysis of Variance
709
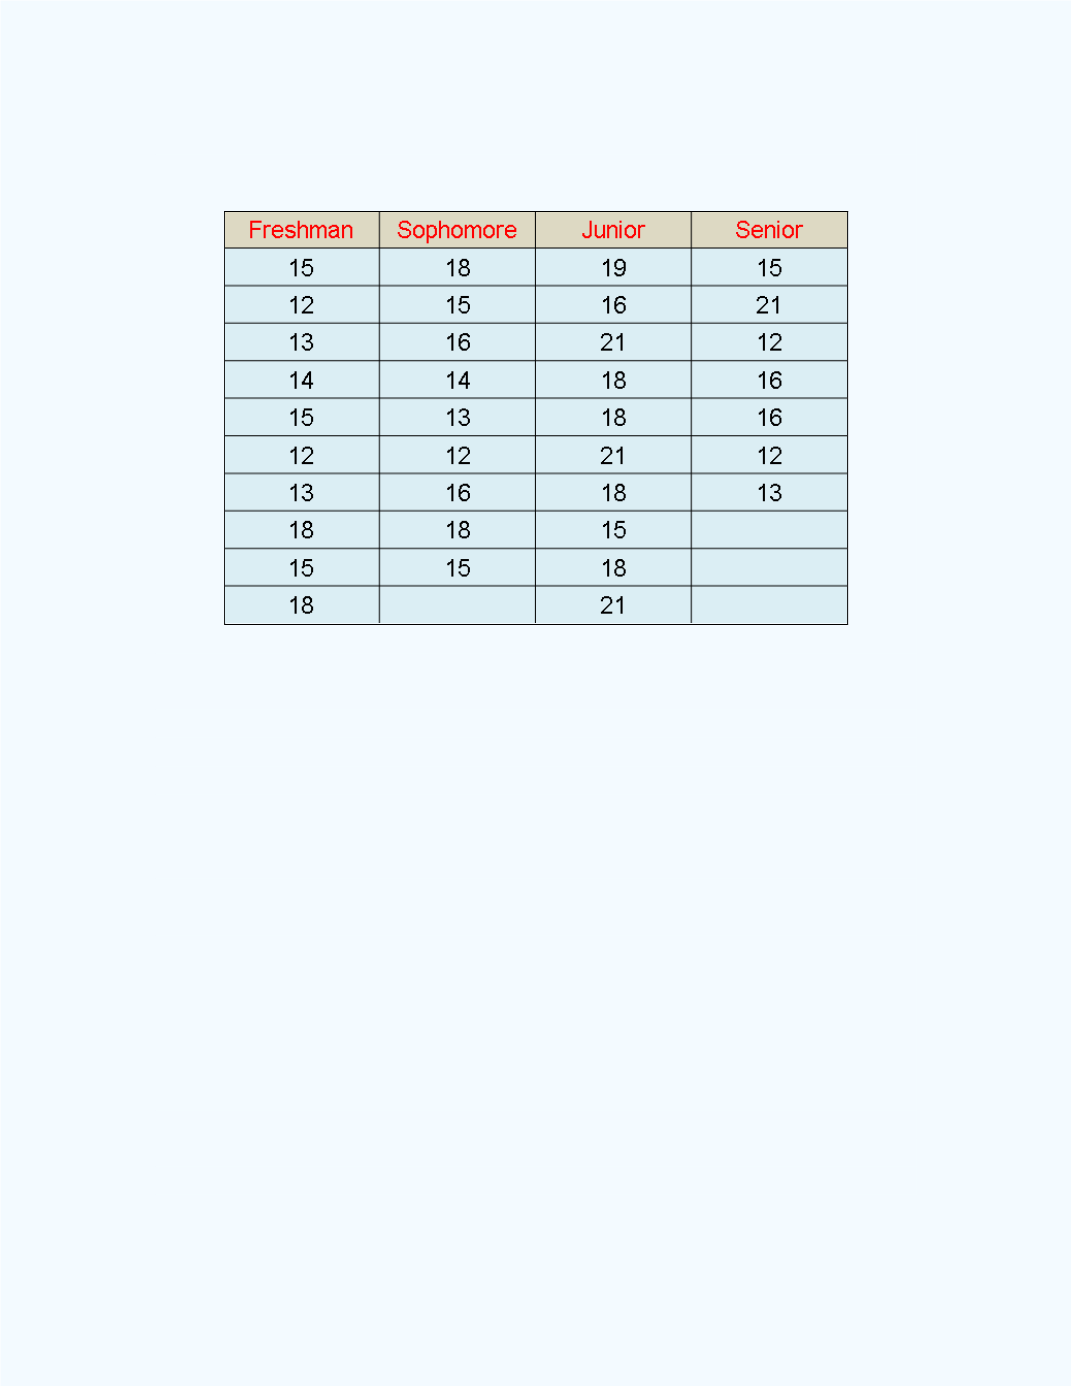
Table 16-1:
Summary of the number of credit
hours for which the students were enrolled
Note:
We can consider each of the four data sets as samples from their
respective populations of freshmen, sophomores, juniors, and seniors.
Compute the sample means and display the data using box plots. Are there
any differences in the means of the potential populations from which these
samples were obtained? If the sample means are different, are the
differences large enough so that one may conclude that the means of the
populations from which these samples were obtained may be significantly
different? That is, if the average number of credit hours for the
classifications is different, does this tell us that the average number of credit
hours for these classifications for the entire student population is expected to
be different.
Solution:
We can use the
Basic Statistics
workbook to help with the
computation of the means. The sample means for the number of credit hours
for the classifications of freshman, sophomore, junior, and senior are
respectively 14.500, 15.222, 18.500, and 15.000.
The
Basic Statistics
workbook output is shown in
Figure 16-1
. The four samples were entered in
the Data1, Data 2, Data 3, and the Data 4 columns.