


 712 / 762

712
Chapter 16: One-Way Analysis of Variance
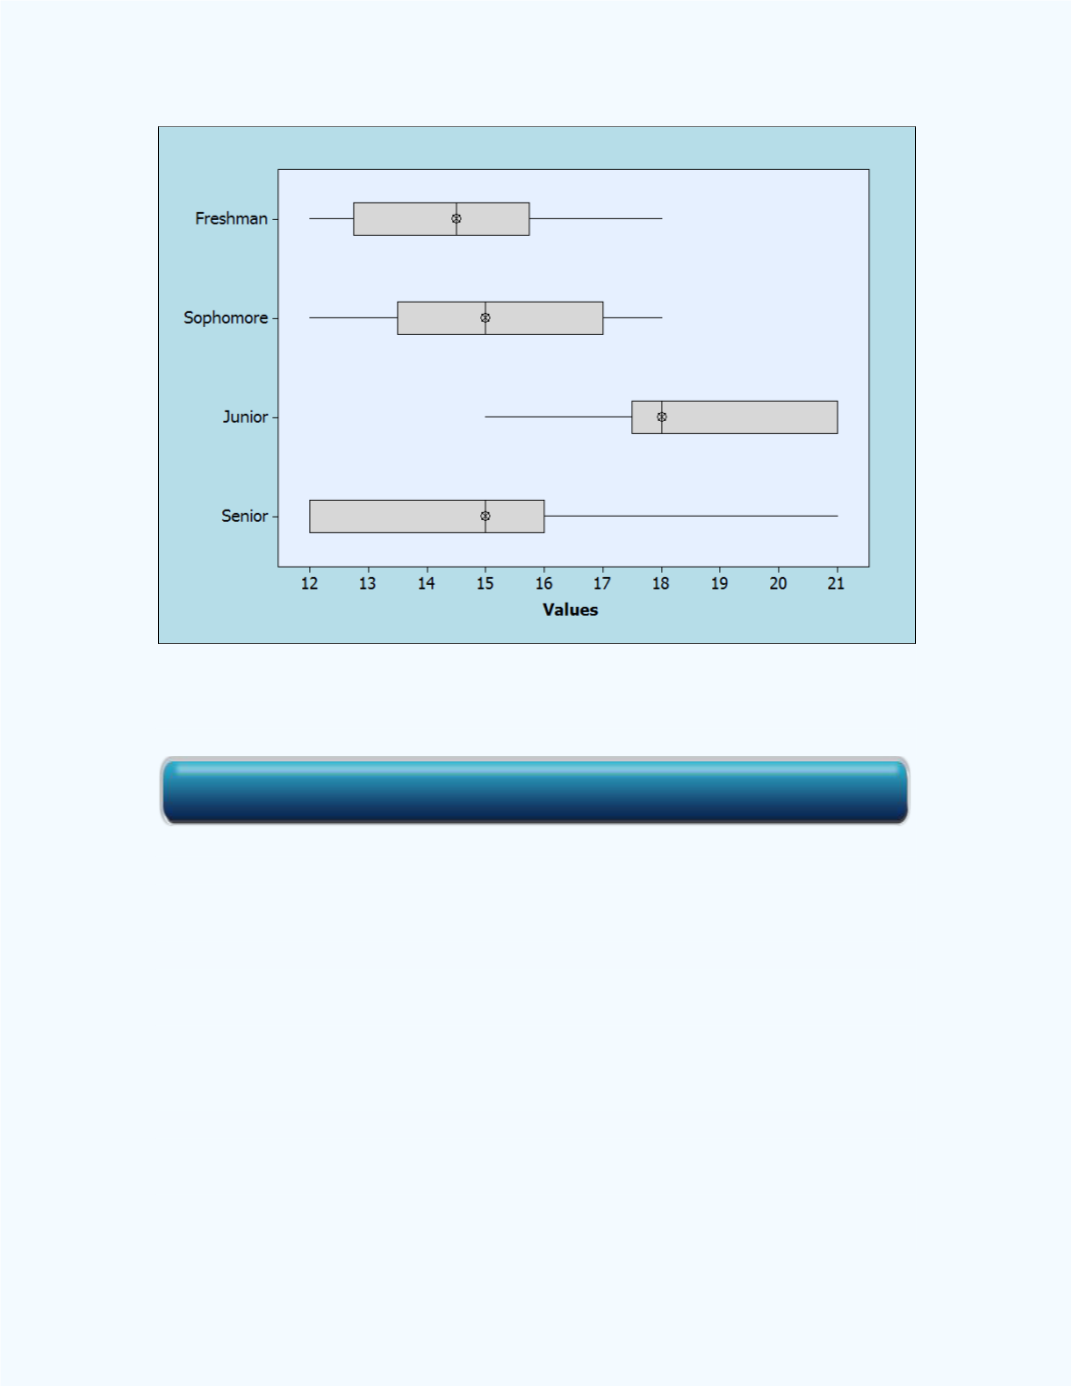
Figure 16-2:
Box plot display for the different
Classifications
Another way to observe this difference is to compute the one sample
confidence intervals. The 95% confidence intervals for the number of credit
hours for the different classifications are – freshman: 14.5 ± 1.504 or
(12.996, 16.004); sophomore: 15.2222 ± 1.586 or (13.6362, 16.8082);
junior: 18.5 ± 1.504 or (16.996, 20.004); seniors: 15 ± 1.798 or (13.202,
16.798). From the confidence intervals, we see that the interval for the
number of credit hours for the junior classification barely overlaps at the
lower end point (16.996) with the upper end point (16.8082) for the
sophomore classification. In addition, the confidence interval for the junior
classification does not overlap with the others. Based on these observations
one may infer that the population average for the number of credit hours for
the junior classification might be significantly different from the averages
for the other classifications. A display of the confidence intervals is shown
in
Figure 16-3
.
Click here for the Multiple Box Plots Workbook