


 710 / 762

710
Chapter 16: One-Way Analysis of Variance
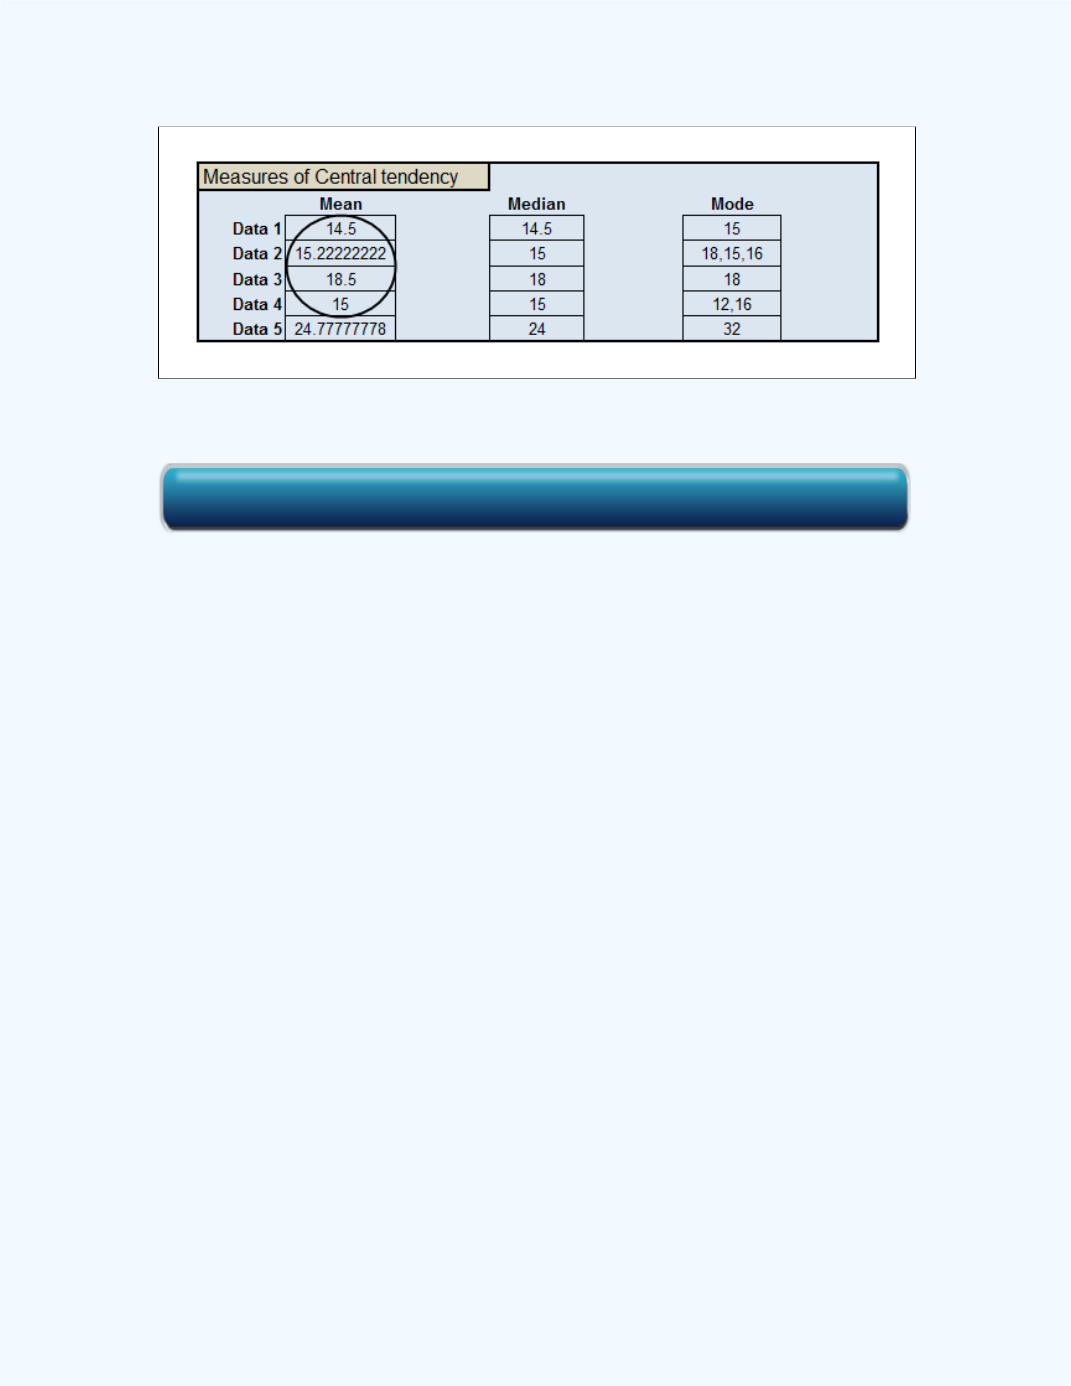
Figure 16-1
:
Basic Statistics
output with means for
Example 16-1
Observe that the average number of credit hours for the junior classification
(Data 3) seem to be an outlying value relative to the values of the other
means. Is this difference large enough to infer that the corresponding
population mean for the number of credit hours in the junior classification is
significantly different (in this case greater) than the population means for the
number of credit hours for the freshman, sophomore, and junior
classifications for the entire student population for that particular campus?
Further discussions will help to answer this question.
A display of the box plots is shown in
Figure 16-2
. The box plots can give
some insight as to whether these differences are significant. Observe that
the box in the box plot for the number of credit hours for the junior
classification does not overlap with the boxes in the plots for the other
classifications. As a rule of thumb, when the boxes do not overlap, one may
infer that the population averages may be significantly different. Thus,
based on this rule of thumb, one may infer that the population average for
the number of credit hours for the junior classification may be significantly
different from the averages for the other three classifications.
Click here for the Basic Statistics Workbook