


 726 / 762

726
Chapter 16: One-Way Analysis of Variance
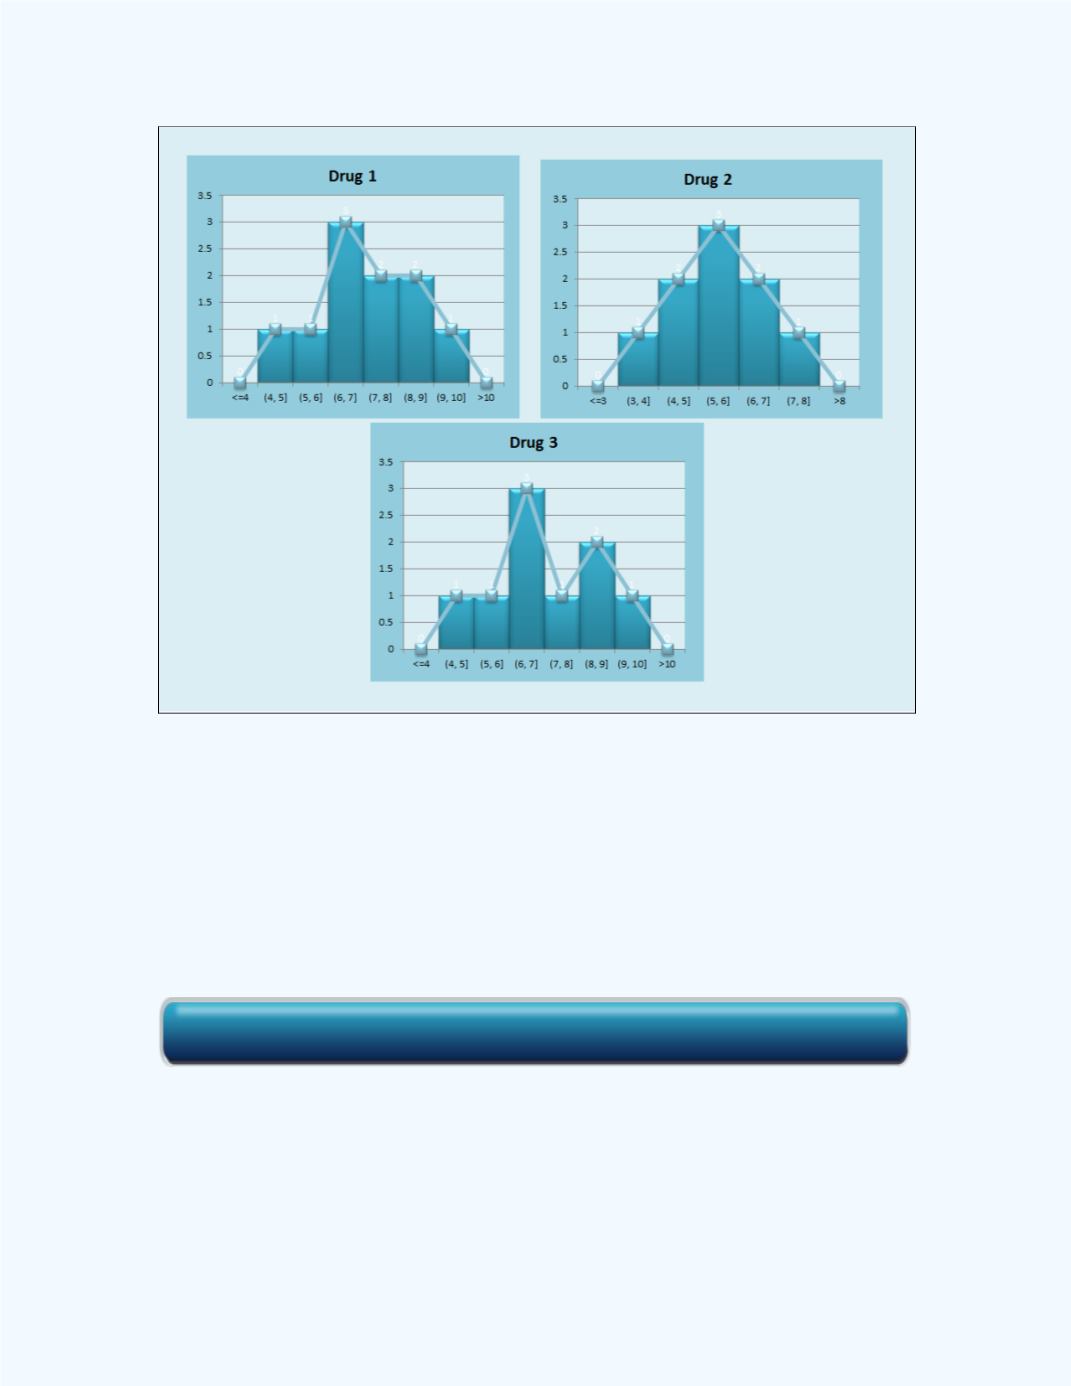
Figure 16-8:
Histograms for the Relief Times for the Three Drugs
We can of course use the
Test for Normality
workbook for more rigor.
Figures 16-9
,
16-10
, and
16-11
shows the output for the normality test for
the data given for Drug 1, Drug 2, and Drug 3. Note for all three
populations, the assumption of normality was not rejected when the
significance level was
= 0.01. Thus, we are now much more confident
that the normality assumption for the populations has not been violated.
Click here for the Test for Normality Workbook