


 739 / 762

Chapter 16: One-Way Analysis of Variance
739
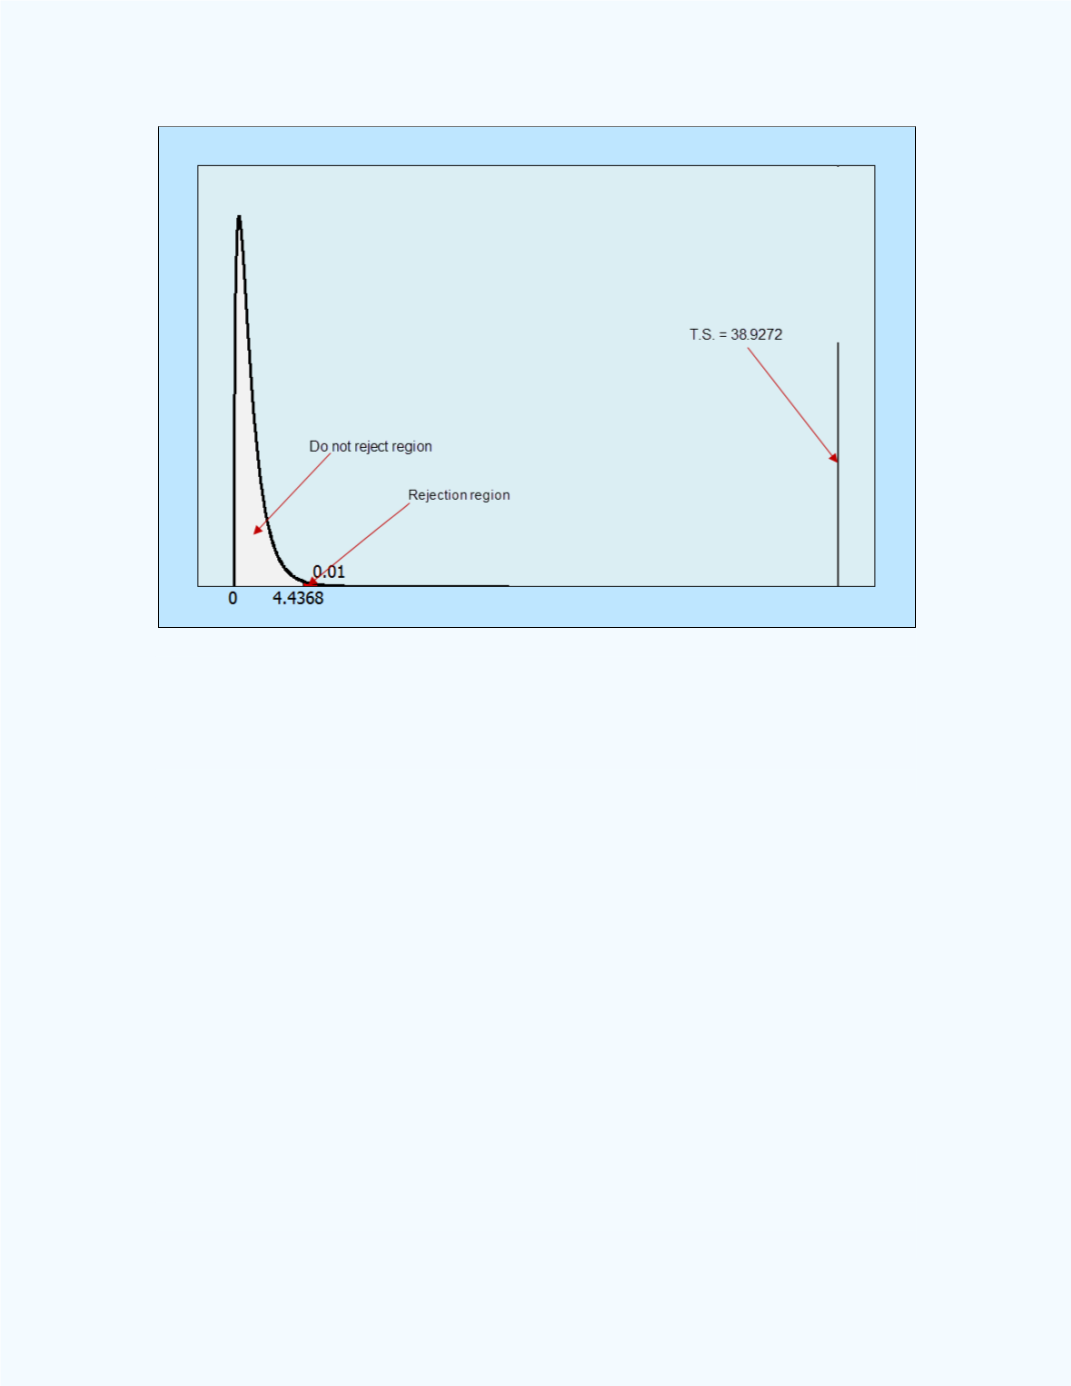
Figure 16-18:
Rejection Region Display for
Example 16-11
Following are some notes for the
Factor
and
Error
sources in the
computations.
The source due to the
factor
in the design is the contribution from the
between
samples. This is the contribution when comparing the
variability of the four sample means.
The
between variability
is associated with the numerator in the
F
-test
statistic computation.
The source due to the
error
in the design is the contribution from the
within
samples. This is the contribution when comparing the
variability for all of the sample data combined.
The
within variability
is associated with denominator in the
F
-test
statistic computation.
In the previous discussions, the classical approach was used to test for the
equality of the average heat loss. We can also use the
P
-value approach to
test for the equality of the average heat loss. Following is the presentation
for the test from a
P
-value approach.