


 743 / 762

Chapter 16: One-Way Analysis of Variance
743
Figure 16-20:
Possible randomization scheme to
Administer the Fertilizers
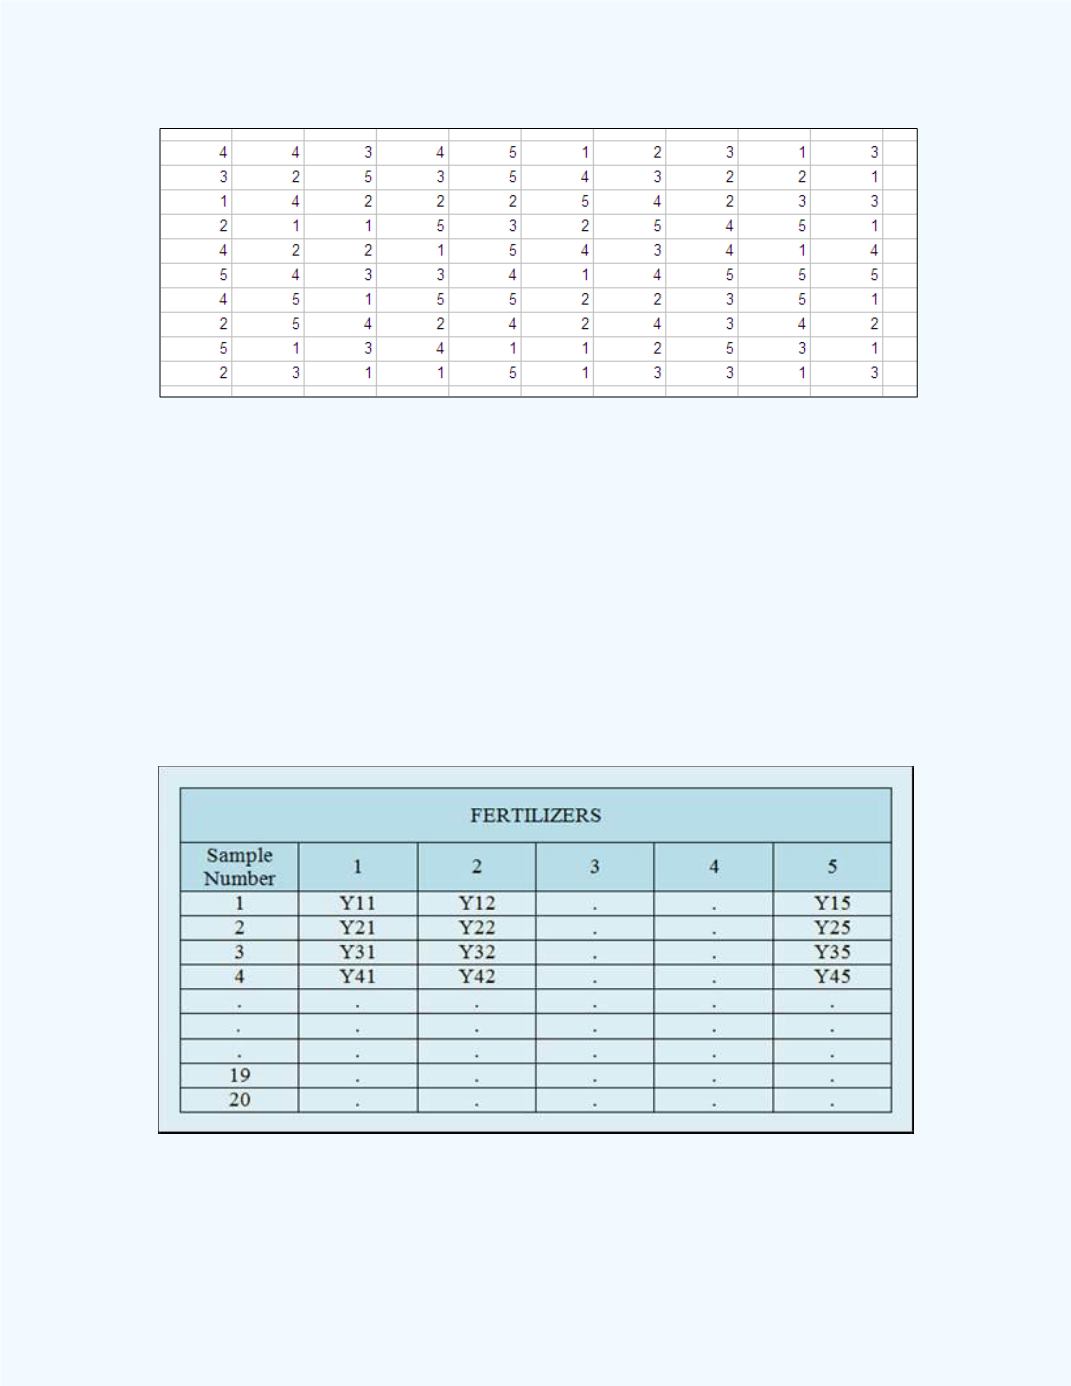
Suppose the farmer uses this randomization and grows his corn crop based
on the parameters described above. At the end of the growing season, the
farmer measures the yield in bushels of corn for each acre. Once the data is
now collected, it can be arranged in a format with regards to the yield for
each fertilizer as shown in
Figure 16-21
where the treatments will be the
different fertilizers. The notation used can be explained in this manner: for
example, Y11 represents the first recorded yield for fertilizer 1; Y45
represents the fourth recorded yield for fertilizer 5 etc.
Figure 16-21:
Recorded Yields for the different Fertilizers