


 749 / 762

Chapter 16: One-Way Analysis of Variance
749
computed for the pairs (
e
1
,
e
2
), (
e
2
,
e
3
), (
e
3
,
e
4
), …, (
e
n
-1
,
e
n
), where
e
i
for
= 1,
2, 3, …,
are the observed errors.
When the errors in the model equation are normally and independently
distributed, the sampling distribution of the lag 1 autocorrelation coefficient
associated with a sample of size
is approximately normal with mean of 0
and standard deviation of
√ ⁄
. Thus, independence of the errors should be
questioned when the absolute value of
r
1
is greater than (1.96)
(
√ ⁄
).
That is, when |
r
1
| > (1.96)
(
√ ⁄
).
The general format for the hypothesis test for independence of the errors is
given below.
H
0
: The errors are independent of each other.
H
1
: The errors are not independent of each other.
T.S
: |
| = (value)
D.R
: Reject the null hypothesis if |
| >
√
.
Conclusion: ….
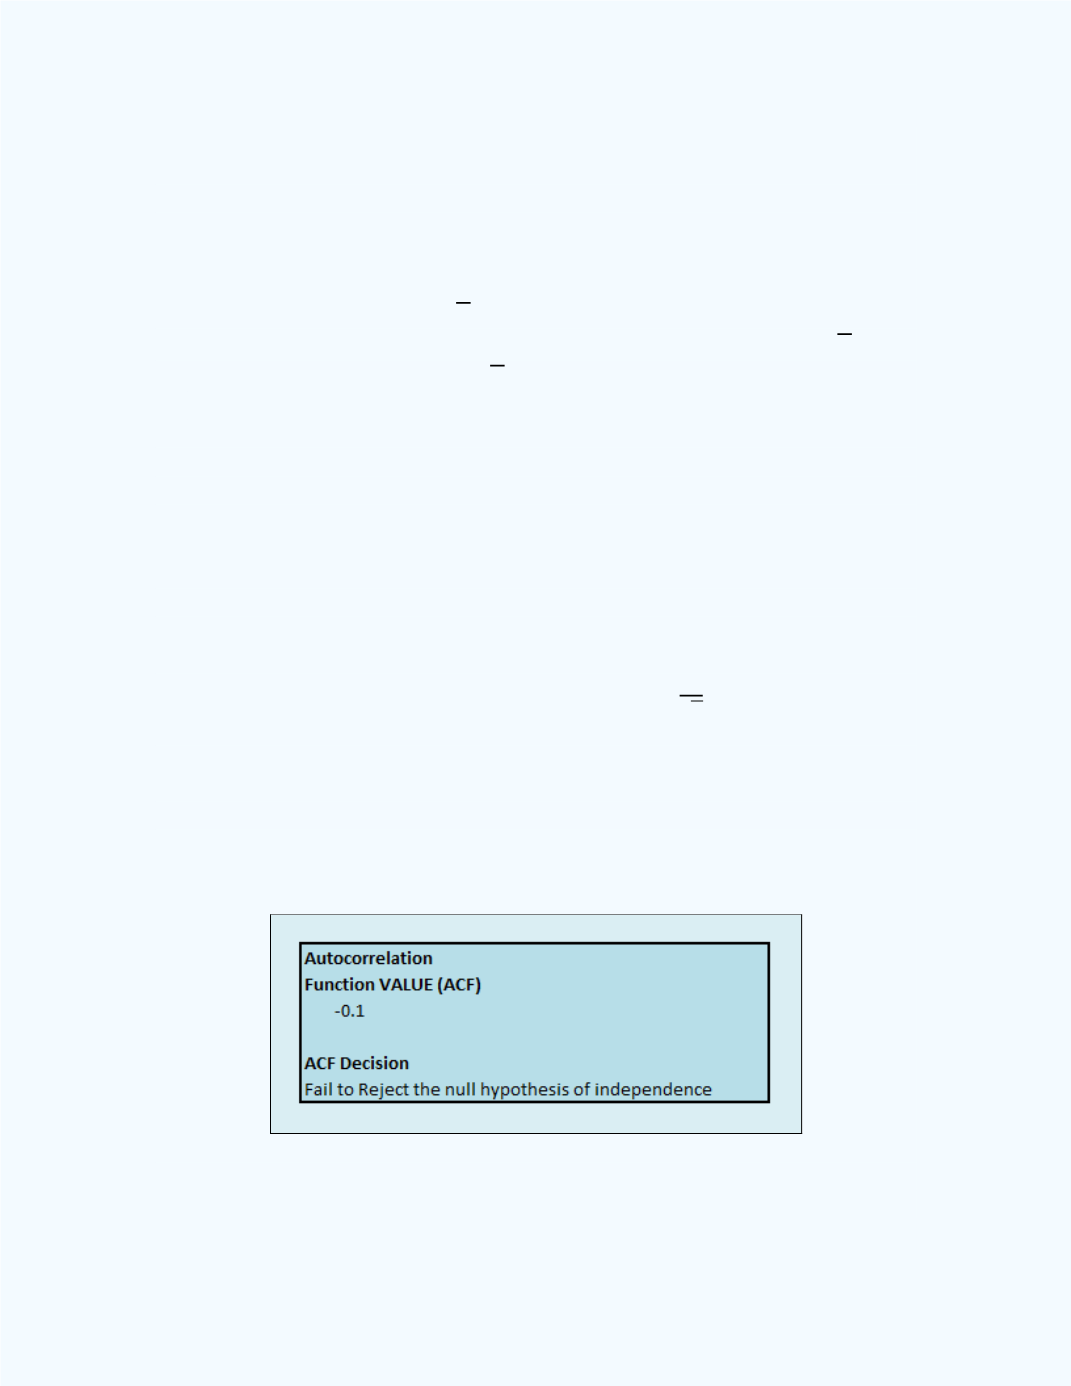
Figure 16-26
shows a portion of the
Auto Correlation Function
output. It
gives the value of the ACF function of -0.1 for the stacked errors from
F
igure 16-23
.
Figure 16-26:
ACF Function for the Errors in
Example 16-12