


 752 / 762

752
Chapter 16: One-Way Analysis of Variance
.:
P
-value = 0.7953 (for Bartlett’s Test)
D.R
.: For a significance level 0.01, reject the null hypothesis if the
computed test statistic value,
P
-value = 0.7953 <
= 0.01.
Conclusion
: Since 0.7953 > 0.01, do not reject the null hypothesis. That
is, at the 1 percent level of significance, there is not enough sample evidence
to reject the null hypothesis of equality of the variances.
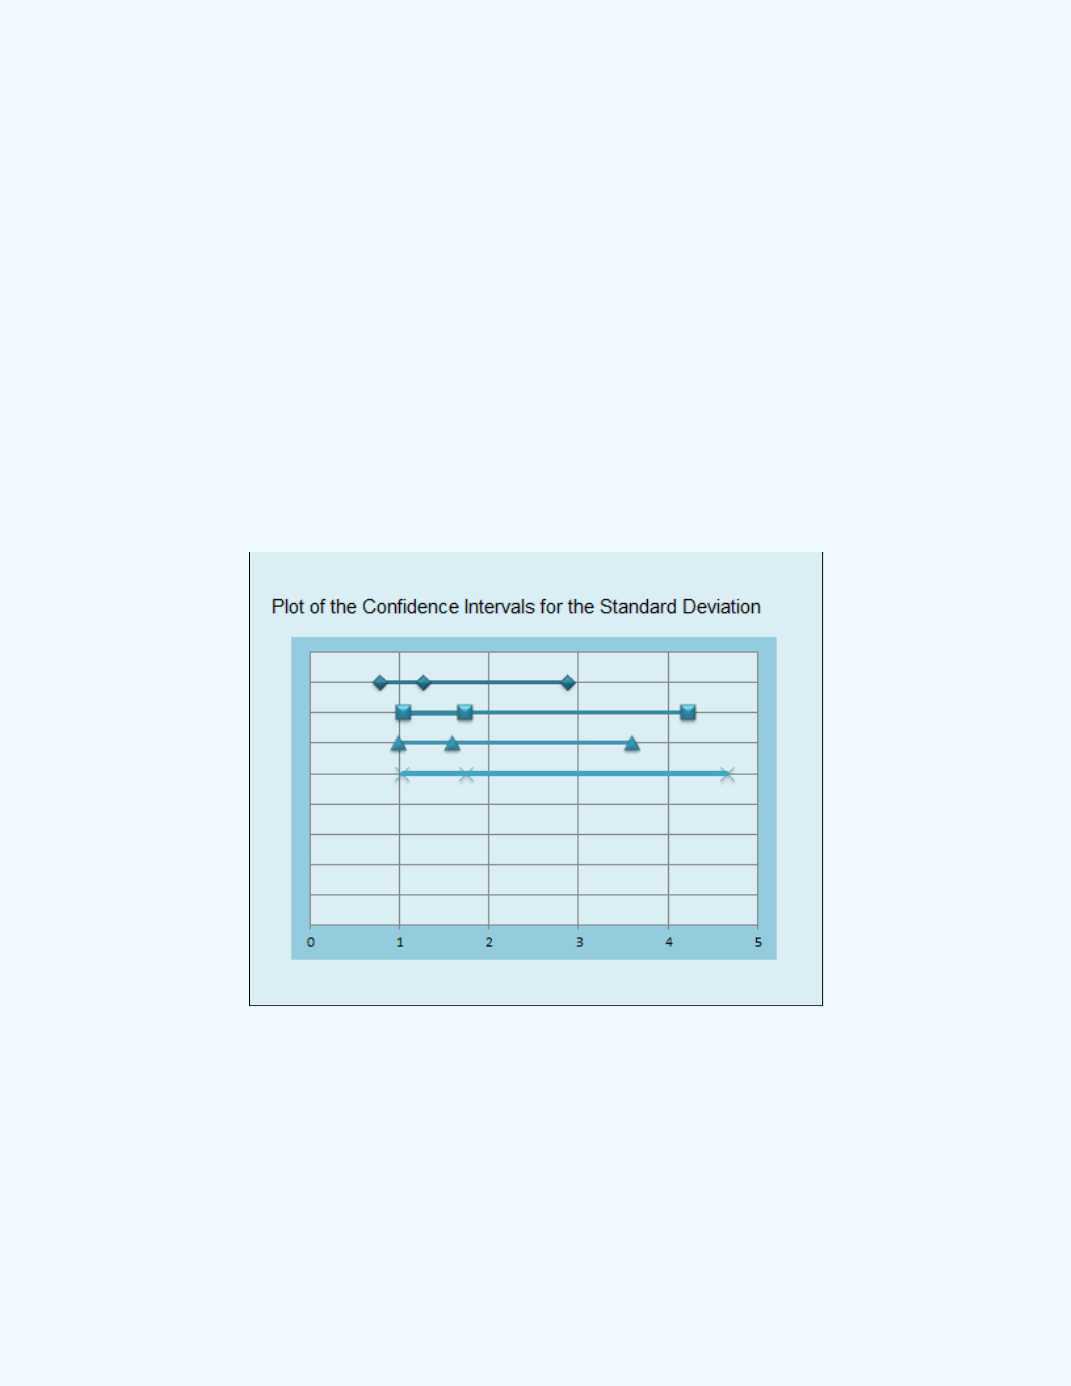
Figure 16-28
shows a plot of the 99% confidence intervals for the standard
deviations of the errors for the four populations (Mix1, Mix2, Mix3, and
Mix4). Observe that they all overlap which suggests that the variances are
not significantly different from each other.
Figure 16-28:
Confidence Intervals for the Standard Deviations
for the Errors in
Example 16-12
Since none of the assumptions for the errors were violated, then one should
be quite confident about the inference for the population averages for the
percentage heat loss for the four different concentrations of the non-toxic
chemical mixes established by the One-Way ANOVA.