


 741 / 762

Chapter 16: One-Way Analysis of Variance
741
other intervals, one can conclude that this population average is significantly
greater than the other population means.
In addition the
One-Way Analysis of Variance Test
workbook displays
pairwise comparisons for all levels of the factor.
Note:
Since the problem dealt with the average heat loss for the different
non-toxic mixes, one would prefer mix 1 to use on the surfaces of the bricks
since the confidence interval is to the left of the others. Although there are
some overlap with the confidence intervals for mix1, mix 2 and mix 4, the
center point value of 12.4 in the confidence interval for mix 1 is to the left of
the lower confidence limits for both confidence intervals for mix 2 and
mix4.
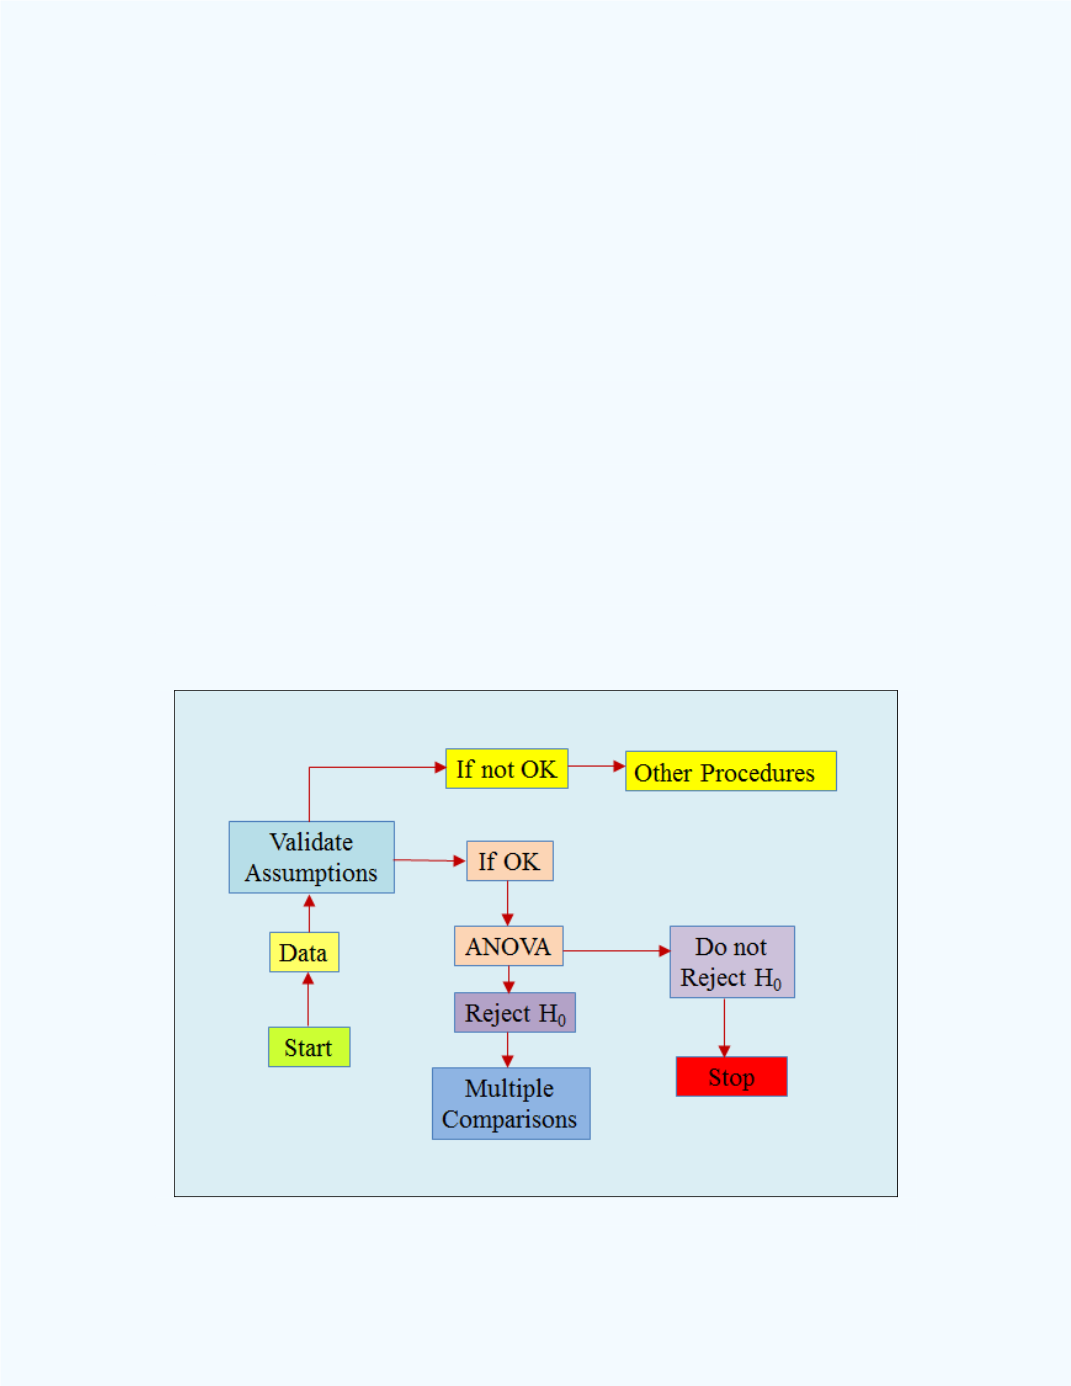
General Logic of the ANOVA Procedure
Figure 16-19
shows a flow chart which maps out the general logic for the
ANOVA process. This general flow can be applied to any problem
requiring the techniques applied in analysis of variance.
Figure 16-19:
The ANOVA Process