


 100 / 762

100
Chapter 3: Measures of Variability
Question:
Why does subtracting the minimum value from the
maximum value in a data set produce a measure of spread or
variability?
The following discussion will give an insight for an explanation to the
question.
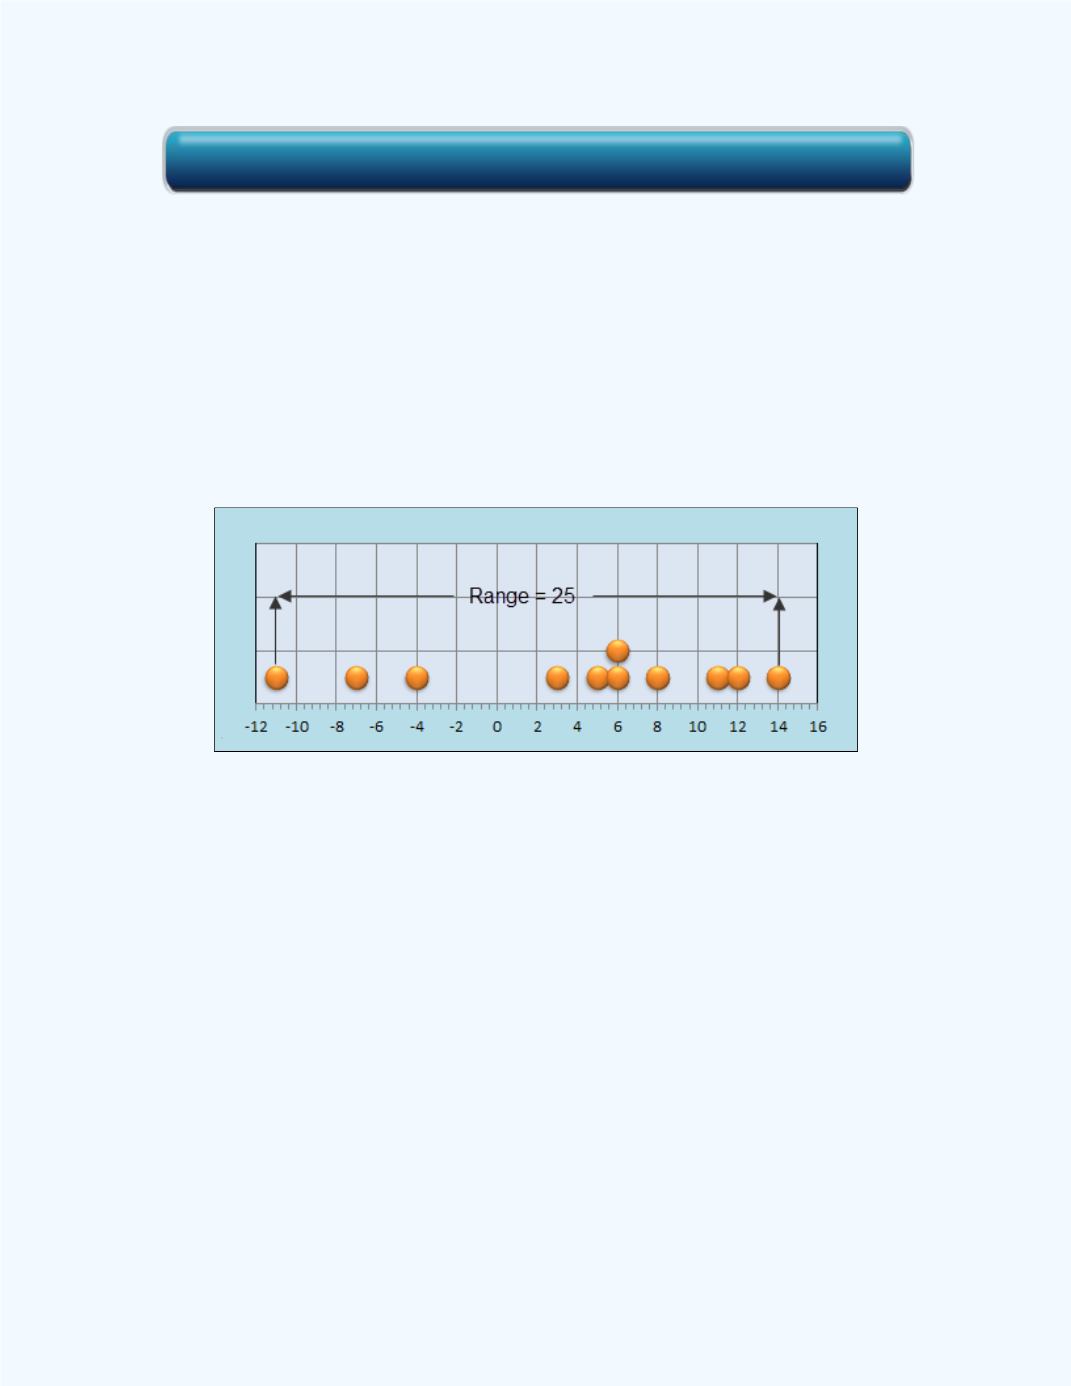
Figure 3-2
shows a plot of the data points with the locations of
the end points. Observe that the range measures the distance between the
maximum and the minimum values and, as such, gives an idea of the spread
of the data set.
Figure 3-2:
Plot of data values showing the distance
between the maximum and minimum
values for
Example 3-1
Following are some notes which deal with the properties of the range. These
properties apply to both sample and population range statistics.
Click here for the Basic Statistics Workbook