


 99 / 762

Chapter 3: Measures of Variability
99
Notes:
When computing the value of the range, the data values can be
population values or sample values.
Hence we can compute either the population range or the sample
range.
The number of data values in the population and the sample are
assumed to be finite.
Example 3-1:
What is the range for the following sample of numerical
values?
3, 8, 6, 14, 5, -4, 11, 12, -7, 6, -11
Solution:
We can arrange the data values in order so as to obtain the
smallest and the largest values in the data set. The ordered set is as follows:
-11, -7, -4, 3, 5, 6, 6, 8, 11, 12, 14
Thus, the sample range =
= 14 – (-11) = 25.
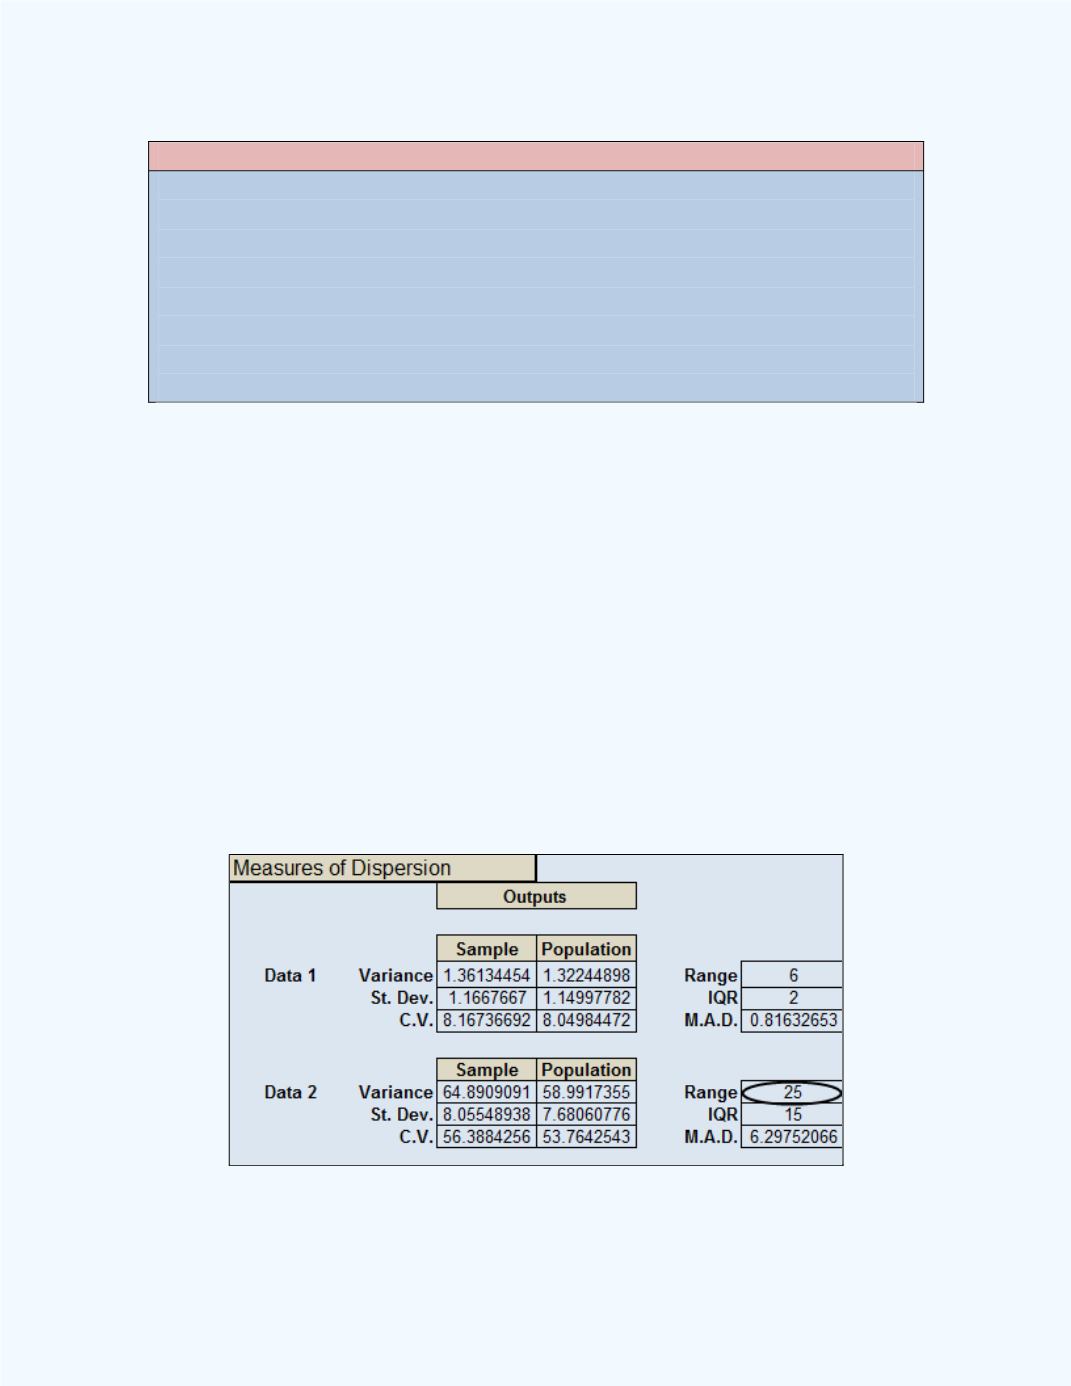
We can also use the
Basic Statistics
workbook to help compute the range
for this data set. Observe the data set was entered in the Data 2 column. The
result is shown in
Figure 3-1
.
Figure 3-1:
Computed Range for
Example 3-1