


 104 / 762

104
Chapter 3: Measures of Variability
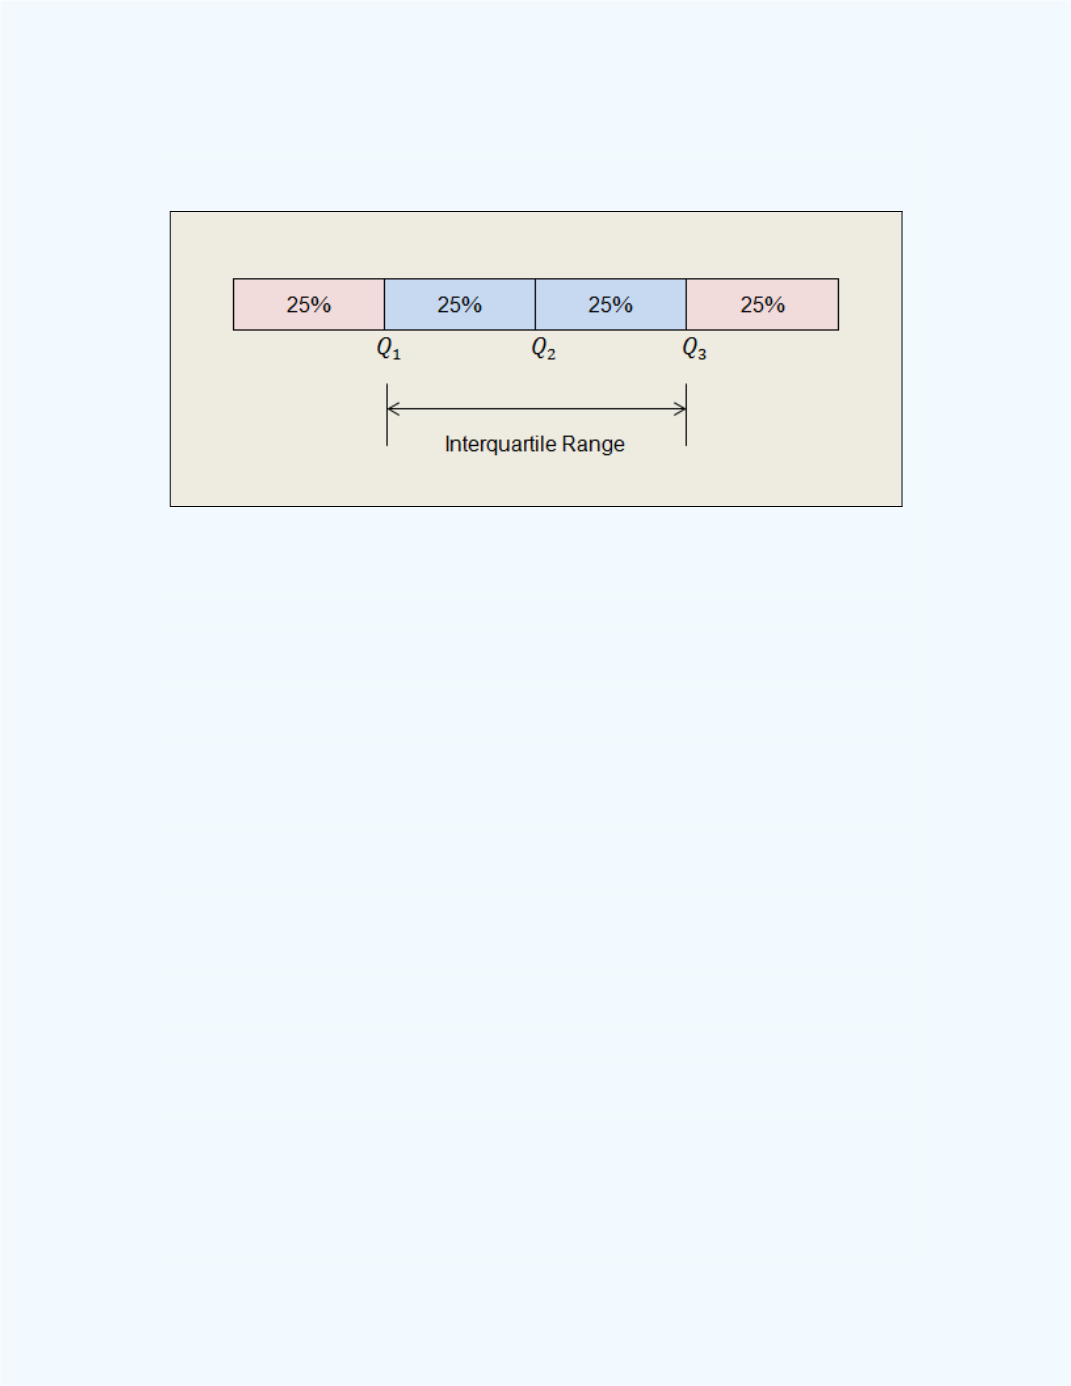
This value will represent the spread of the middle 50% of the ordered data
set.
Figure 3-4
depicts the idea of the interquartile range.
Figure 3-4
: General interquartile range
The following example employs the procedure described above to find the
interquartile range for a data set.
Example 3-4:
The following scores for a statistics 10-point quiz were
reported. What is the value of the interquartile range for this data set?
7, 8, 9, 6, 8, 0, 9, 9, 9, 0, 0, 7, 10, 9, 8, 5, 7, 9
Solution:
First, let us arrange the data in order from the minimum value to
the maximum value. This is given next.
0, 0, 0, 5, 6, 7, 7, 7, 8, 8, 8, 9, 9, 9, 9, 9, 9, 10
From this ordered array, the median,
= 8. This is the average of the 9
th
and 10
th
values since the sample size is 18, an even set of numbers.
Next, the first 50% of the data (excluding
) contains the elements
0, 0, 0, 5, 6, 7, 7, 7, 8.
The median for this set is 6. This corresponds to the value in the 5
th
position. Thus
is 6.