


 107 / 762

Chapter 3: Measures of Variability
107
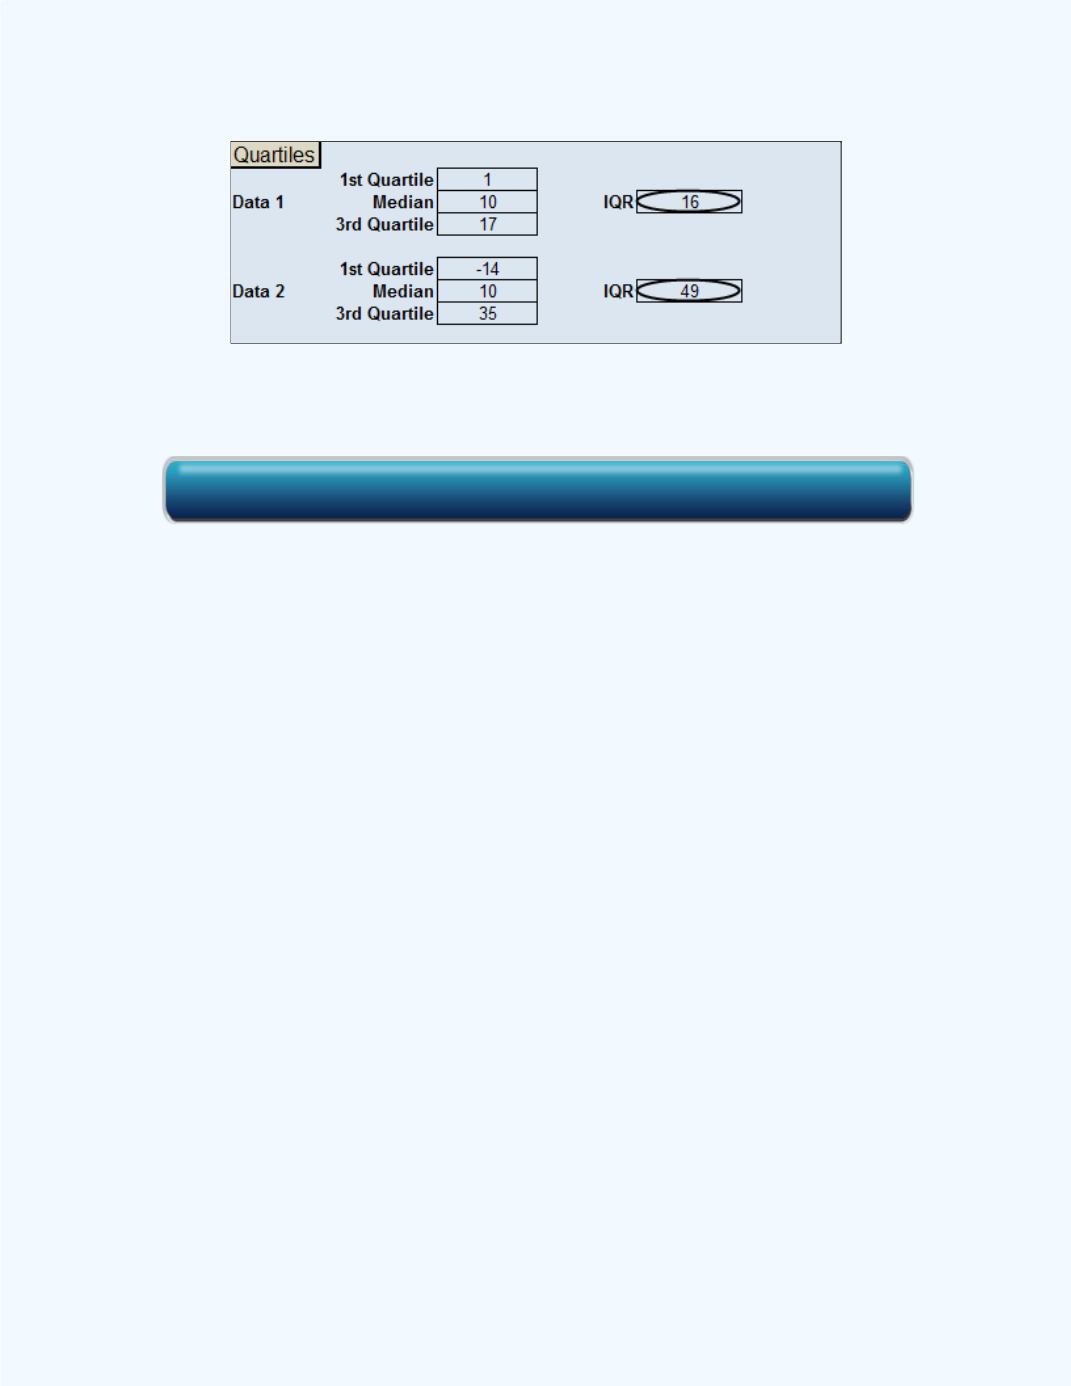
Figure 3-7:
Computed Quartiles, Medians and
Interquartile Ranges for
Example 3-5
Observe that the medians are equal but the interquartile range for data set B
is greater than the interquartile range for data set A. This would indicate that
there is more variability in the middle 50% for data set B compared to the
middle 50% for data set A. Note the data sets have to be ordered.
Figure 3-8
shows dot plots for the data sets. Observe that there is more
variability in the middle 50% for data set B when compared to the middle
50% for data set A.
Click here for the Basic Statistics Workbook