


 111 / 762

Chapter 3: Measuresof Variability
111
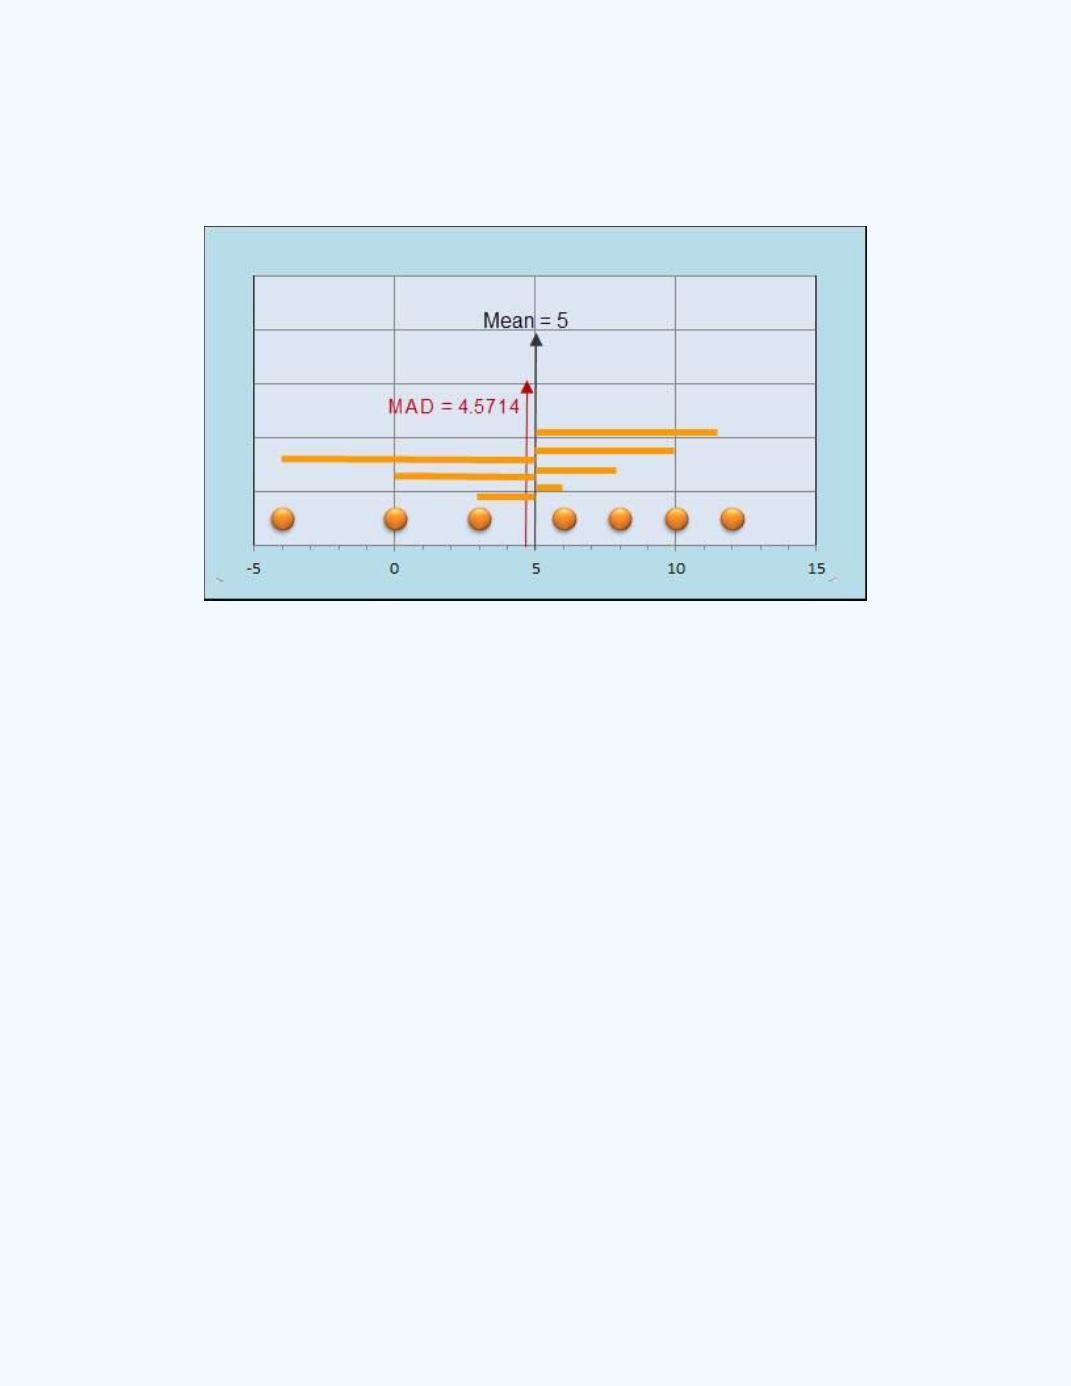
Figure 3-10
showsa dotplot of the data pointswith the location of the
samplemean, the
and the deviations from the samplemean.
Figure 3-10:
Displayof
the deviations,meanand
the
MAD
for
Example3-6
Observe that the absolute deviations will contribute to the total in proportion
to the size of the deviation. It is desirable todefine a variability measure in
which eachdata value contributes in proportionto its distance from the
mean, as in the casewith themean absolute deviation.
Question:
Whycanwe use the
MAD
as ameasureofvariability?
The following discussionwill help to answer this question. Wewill use two
different data setswith equal sample sizes tohelp set up the discussion.
Example3-7:
For the two
data sets, find themeans and the
s.
DataSetA:
-75, -31, -14, -5, 5, 10, 15, 20, 35, 50, 100.
DataSetB:
5, 5, 0, 5, 8, 10, 13, 15, 17, 22, 10.