


 113 / 762

Chapter 3: Measures of Variability
113
Note:
We used data sets with equal sample sizes for the illustration.
This was restricted in order to make the variability comparison much
more realistic. If the sample sizes are not equal, one should expect
generally, the same conclusion as above.
Notes:
If data set A has a larger
than data set B, then it is reasonable to
believe that the values in data set A are more spread out (variable)
than the values in data set B about the same mean when the sample
sizes are equal.
The
is sensitive to values that are very small or very large
relative to the rest of the data set.
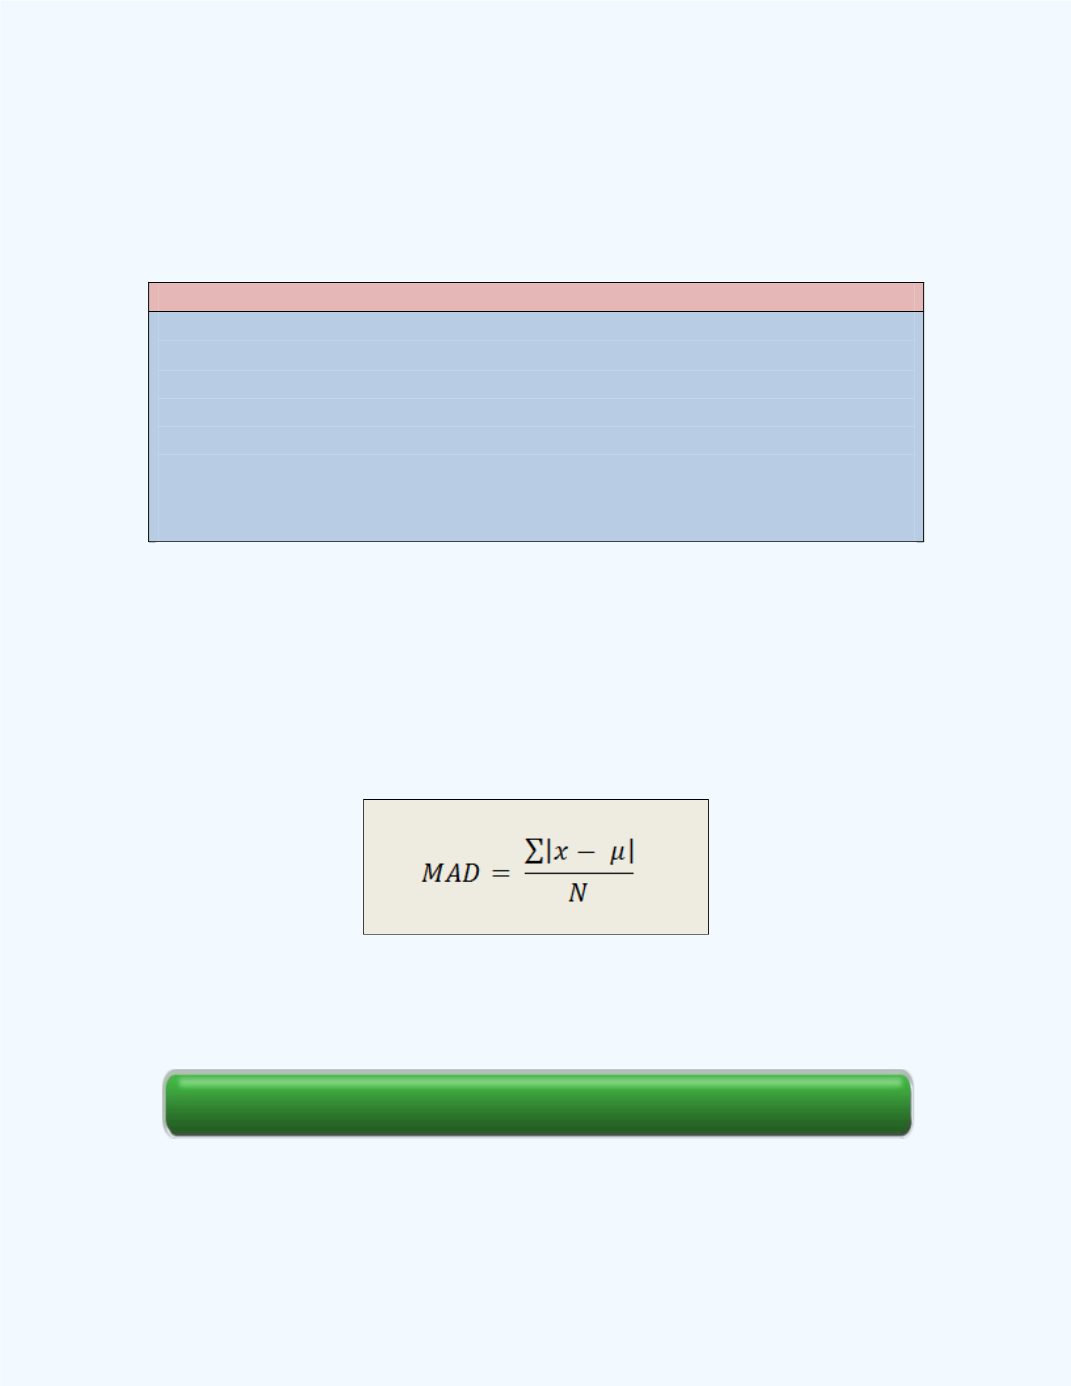
Note, we can also compute the
for a finite population as well. The
Basic Statistics
workbook will compute this value for you. The workbook
will not differentiate between a sample and population values when
computing the
since it computes the mean for the data set and uses the
number of values in the data set. The population
is computed from the
following relationship where
represents the population men and
represents the size of the population.
Section Review
Next, we will discuss two of the most useful measures of variability.
e-Self Review