


 110 / 762

110
Chapter 3: Measures of Variability
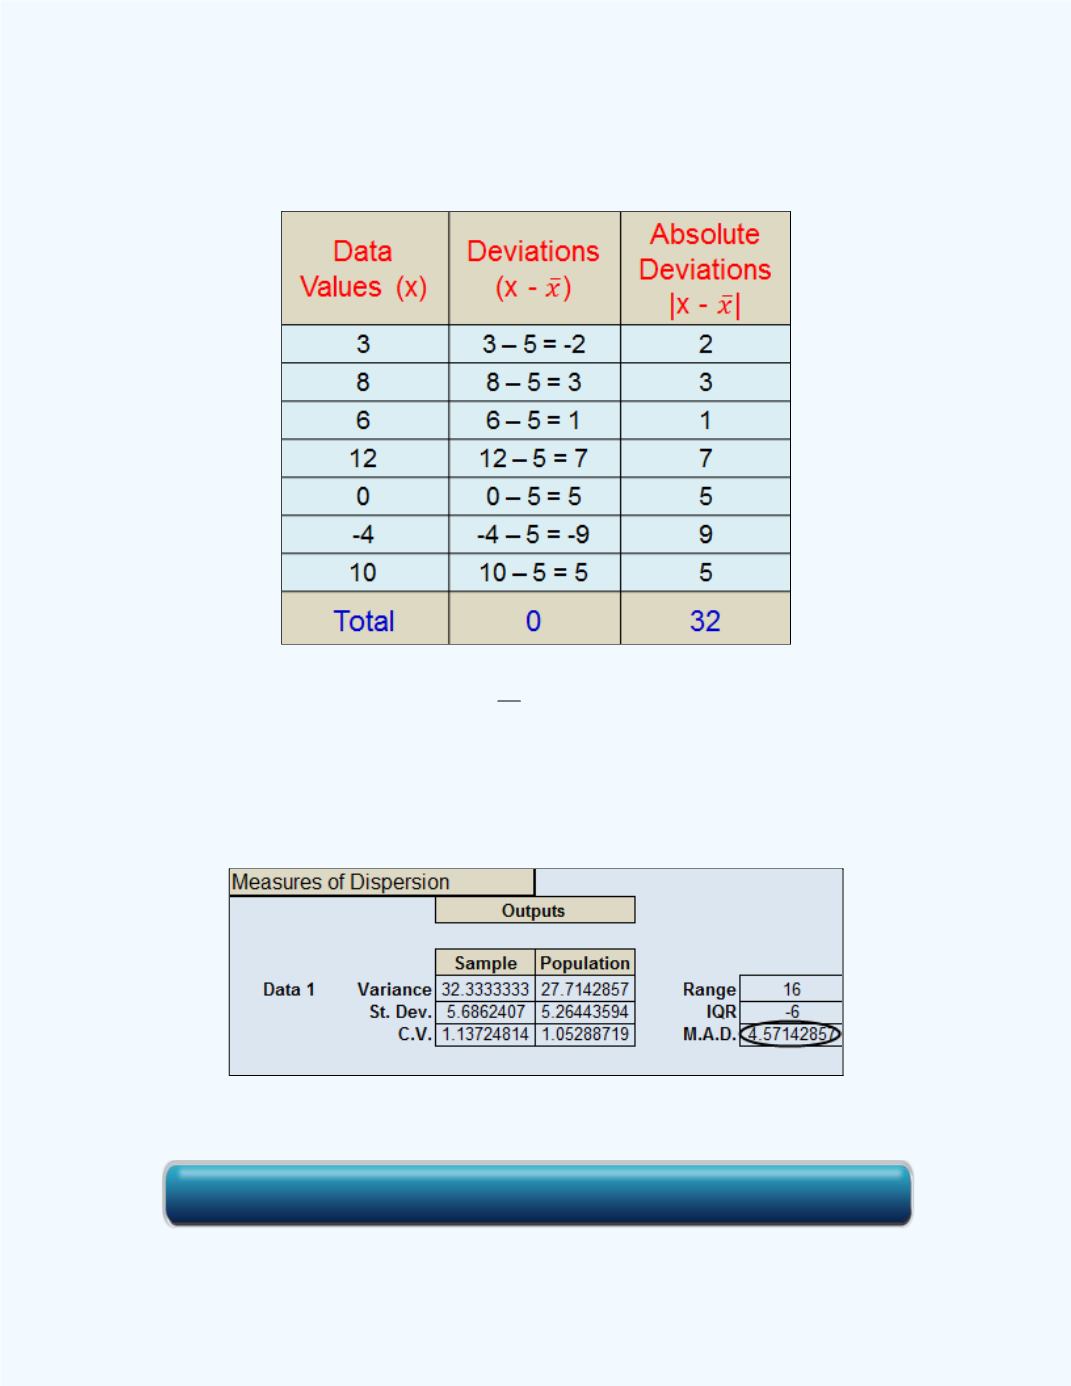
Table 3-1:
Deviations and Absolute Deviations
for
Example 3-6
Thus from
Table 3-1
, the
=
57.4
7
32
14 (to four decimal places). That
is, the average (absolute) distance of these sample values from the mean is
4.5714. We can use the
Basic Statistics
workbook to compute this value.
The output is given in
Figure 3-9
. Note the data was entered in the Data 1
column.
Figure 3-9:
Display of
the
MAD
for
Example 3-6
Click here for the Basic Statistics Workbook