


 183 / 762

Chapter 5: Bivariate Data
183
Notation:
We will let
y
represent the dependent variable and we will let
x
represent the independent variable.
Also, the dependent variable
y
is sometimes called the
response variable
and the independent variable
x
is called the
predictor variable
.
In this example, it is clear that the dependent variable will be the number of
traffic tickets issued since this will depend on the number of drivers who
were caught breaking the speed limit. Thus, the independent variable will be
the number of drivers who were caught breaking the speed limit.
That is, based on the
x
and
y
notation:
y
= number of traffic tickets issued
x
= number of drivers who were caught breaking the speed limit.
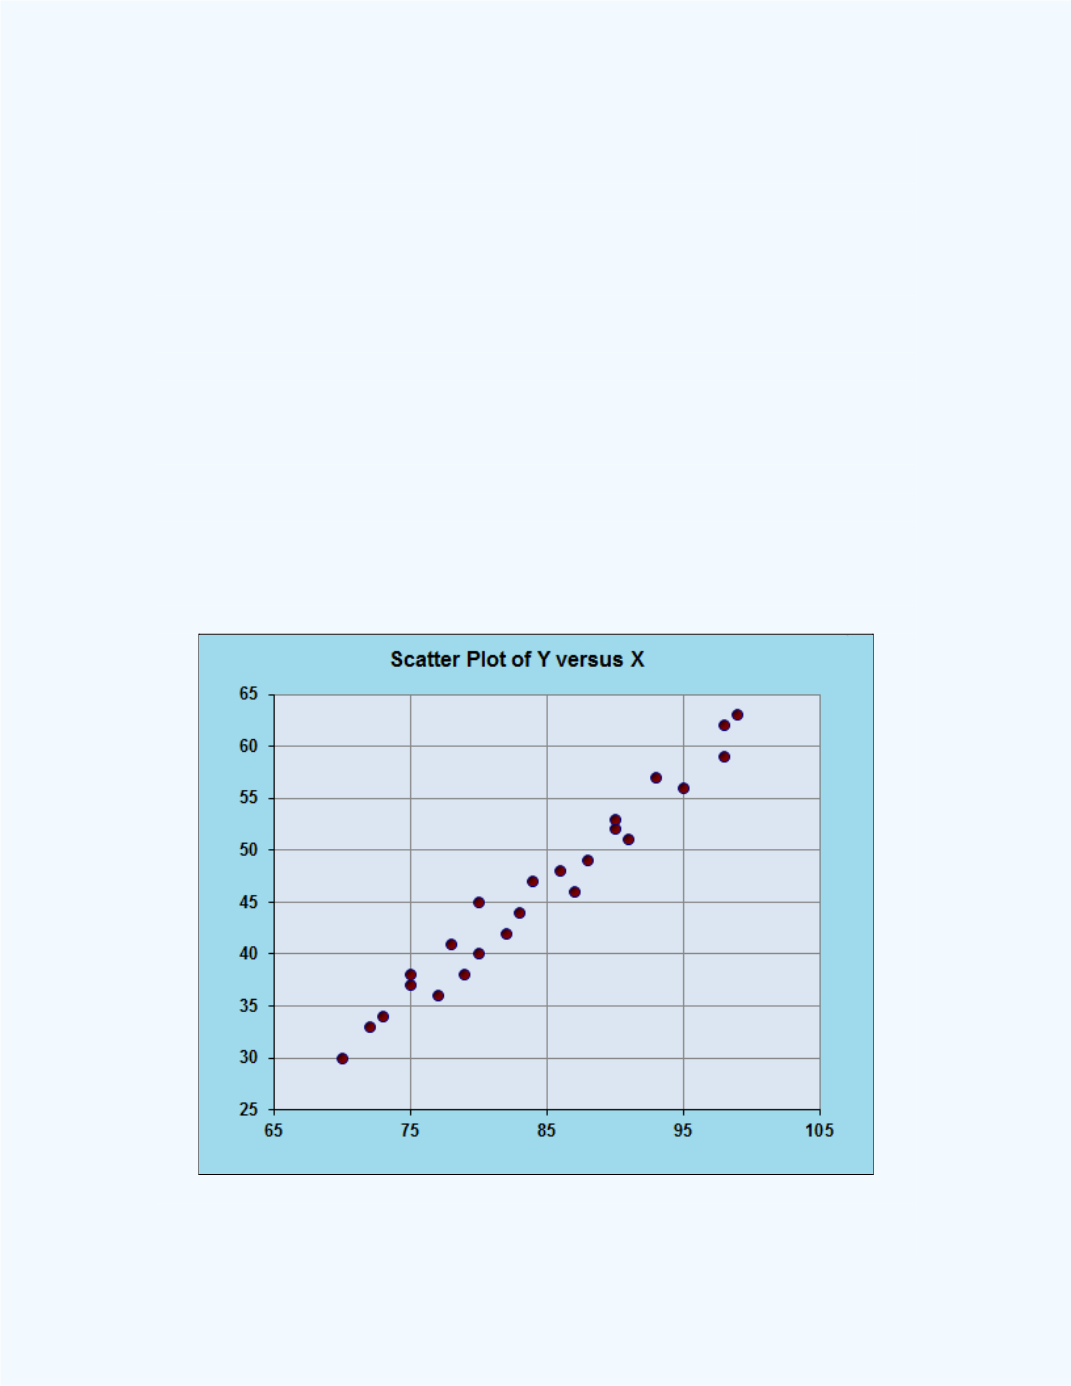
Following is the plot of
y
versus
x
. Such plots are called
scatter plots
.
Figure 5-1:
Scatter plot for data in
Example 5-1