


 182 / 762

182
Chapter 5: Bivariate Data
correlation or regression analysis is considered, the first thing one should do
with the bivariate data is to display it graphically. To illustrate, consider the
following example.
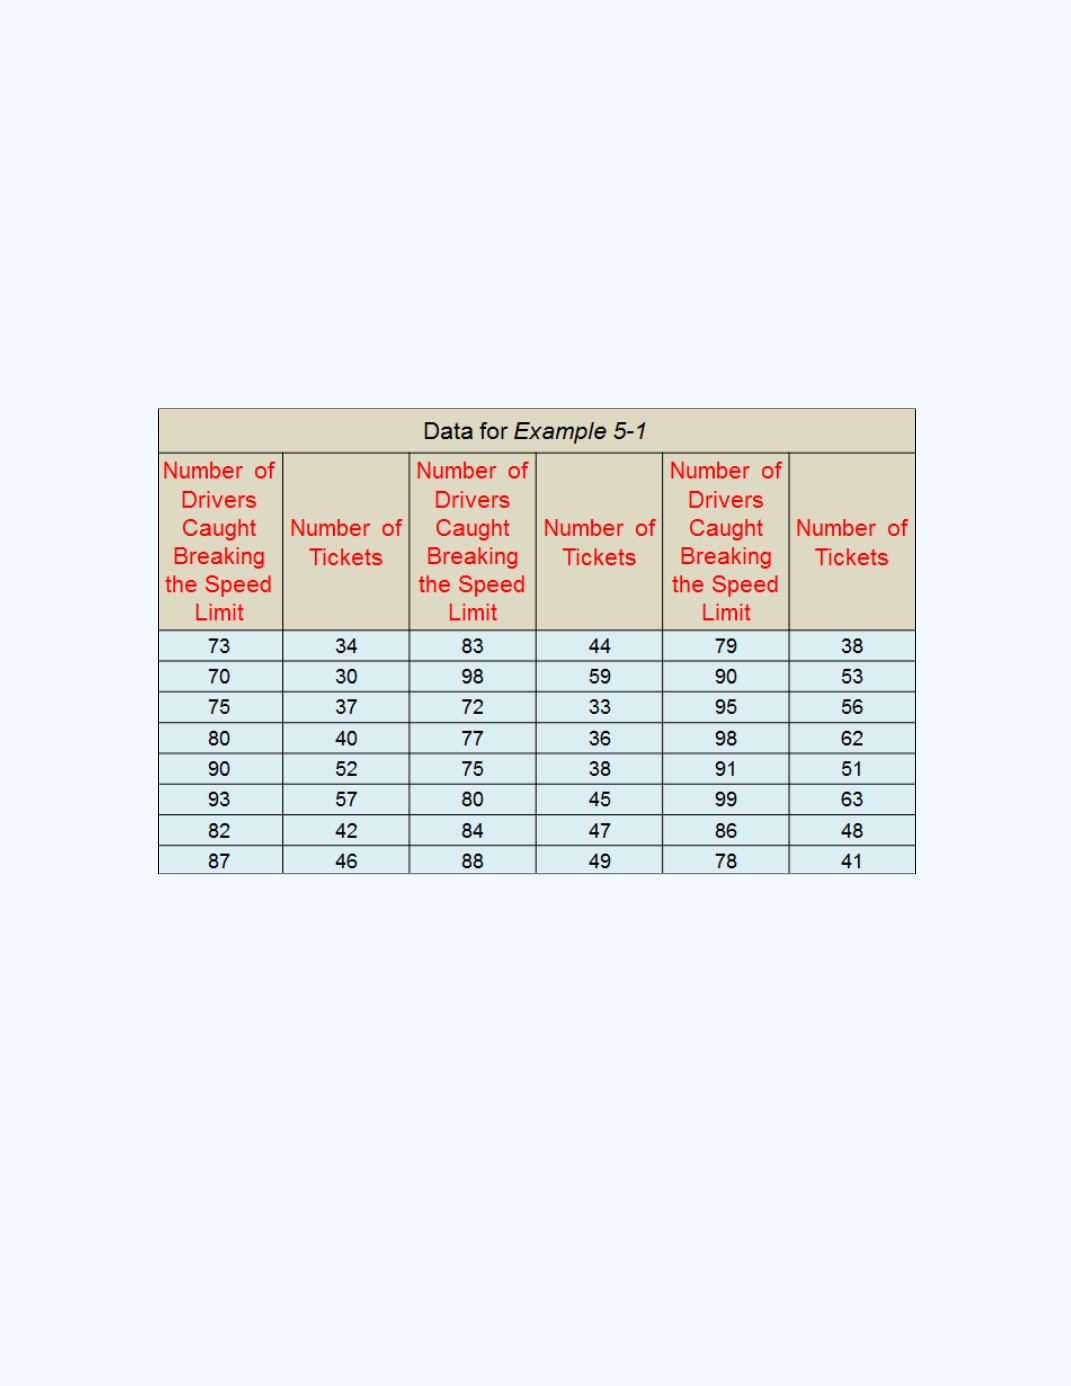
Example 5-1:
Bivariate data were collected which relates the number of
drivers caught breaking the speed limit per month on a stretch of a state
highway and the number of speeding tickets issued per month over a 24
month period. Following are the collected data. Note: some of the speeders
were just given a warning and were not issued a speeding ticket.
The objective here is to graphically study the association between the
number of drivers caught breaking the speed limit and the number of
speeding tickets issued.
Since there are two variables to deal with, then we may be able to display
the pairs of data on a two-dimensional graph. Recall, in a two dimensional
graph, we will plot one variable along the vertical axis and one variable
along the horizontal axis.
The variable plotted along the vertical axis is usually called the
dependent
variable
. The variable plotted along the horizontal axis is usually called the
independent variable
.