


 177 / 762

Chapter 4: Measures of Position
177
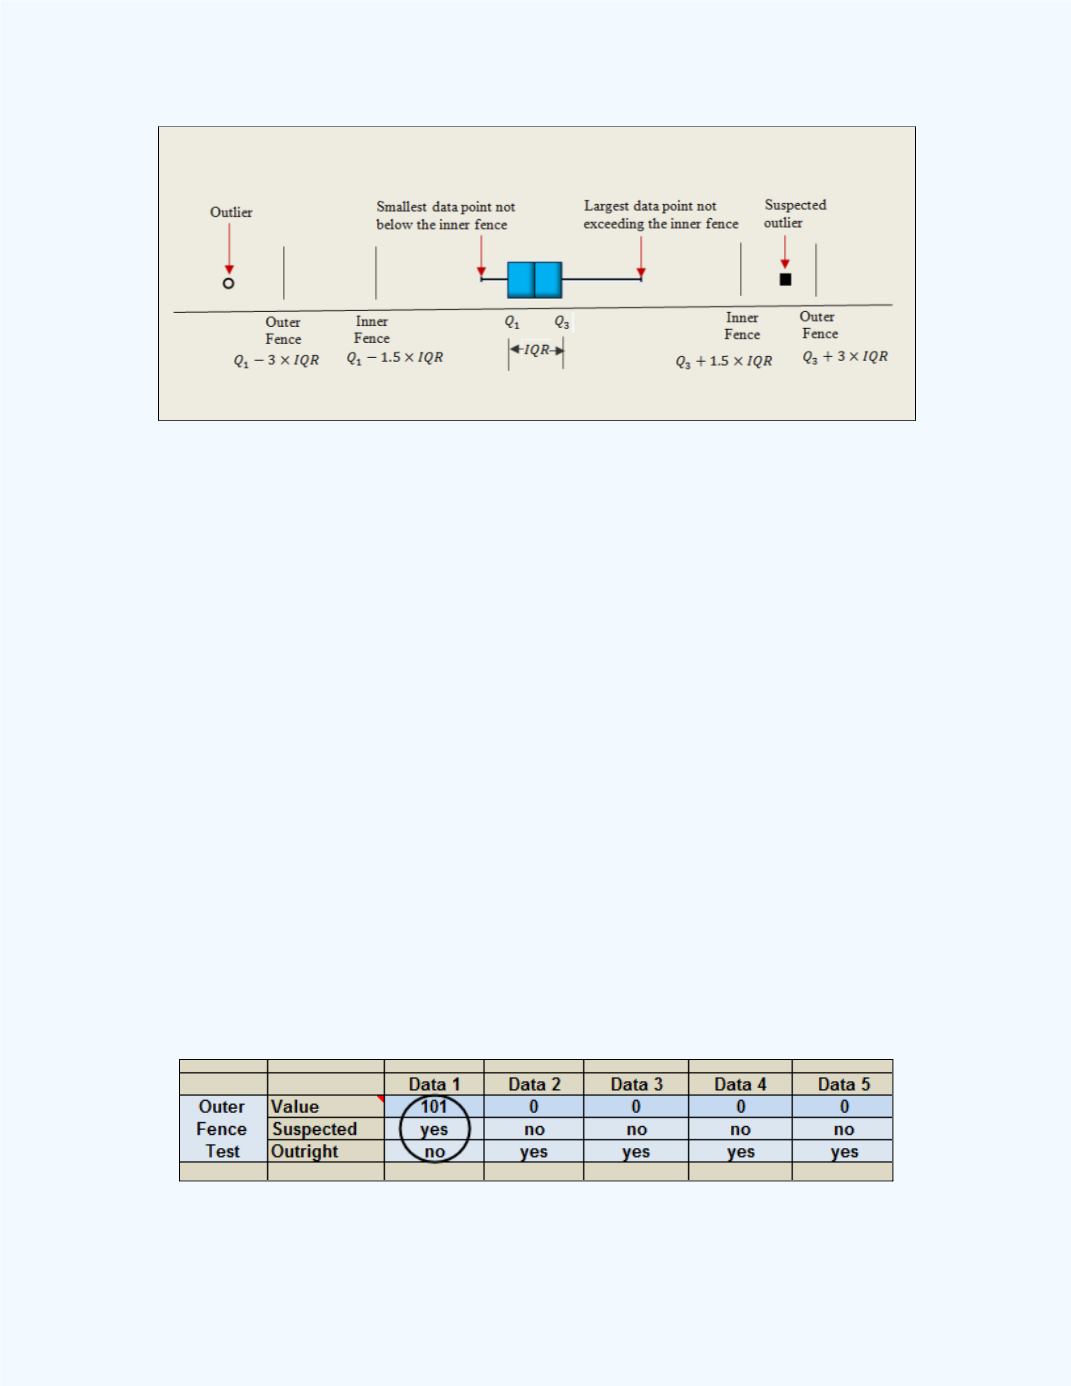
Figure 4-27:
Box Plot with the inner and outer fences
Example 4-12
: Using the data from
Example 4-11
, determine whether
the number of medals won by the USA in the 1996 Summer Olympic Games
is an outright outlier based on the
Outer Fence Test
.
Solution:
Recall,
=
= 17,
=
= 39,
= 22 and the number of
medals won by the USA in the Games was 101. Now, the value of the lower
outer fence is
- 3
= 17 – (3
22) = -49 and the value of the upper
outer fence is
+ 3
= 39 + (3
22) = 105. Since, - 49 < 101 < 105,
the value of 101 is
not
an outright outlier relative to the rest of the values in
the data set based on the
Outer Fence Test
.
Now, the value of the upper inner fence is
+ 1.5
= 39 + (1.5
22) =
72. Observe that 72 < 101 < 105. Thus, based on the
Outer Fence Test
, the
value of 101 is a “suspected” outlier.
We can use the
Outer Fence Test
in the
Basic Statistics
workbook to test
this value of 101. The result is shown in
Figure 4-28
indicating the value of
101 is classified as a suspected outlier based on the
Outer Fence Test
.
4-28:
Results for the Outer Fence Test for
Example 4-12