


 173 / 762

Chapter 4: Measures of Position
173
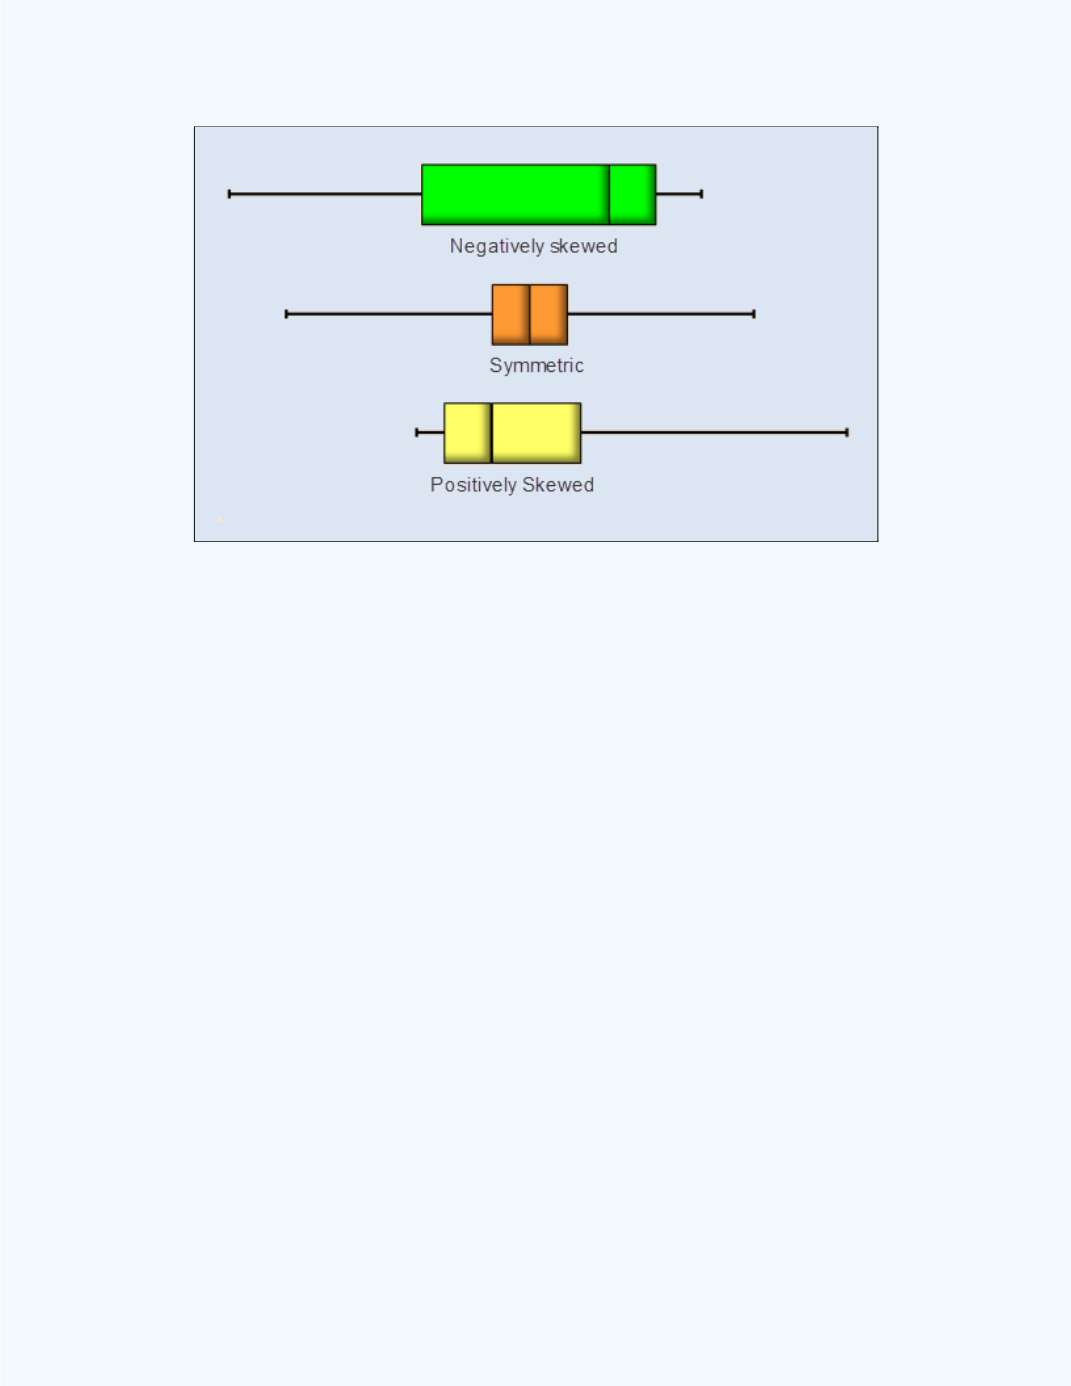
Figure 4-23:
Illustrating the Shape of a Distribution
through the Properties of a Box Plot
Example 4-10:
Given the following information, determine whether the
distribution is negatively skewed, symmetrical, or positively skewed.
(a) Minimum value = 25,
= 30,
= 33,
= 52, maximum value = 70.
(b) Minimum value = 10,
= 25,
= 45,
= 65, maximum value = 80.
(c) Minimum value = 5,
= 40,
= 55,
= 60, maximum value = 65.
Solution:
(a) Observe that length of the left whisker = 30 – 25 = 5 and the
right whisker = 70 – 52 = 18. That is, the right whisker is longer than the
left whisker. Also, the median is only 33 – 30 = 3 units from
and 52 – 33
= 19 units from
. Thus the median is to the left of center in the
interquartile box. From these two observations, we can conclude that the
distribution is skewed to the right, or positively skewed.
(b) Observe that the length of the left whisker = 25 – 10 = 15 and the length
of the right whisker = 80 – 65 = 15. That is, the length of the right whisker
is equal to the length of the left whisker. Also, the median is only 45 – 25 =
20 units from
and 65 – 45 = 20 units from
. Thus the median is