


 171 / 762

Chapter 4: Measures of Position
171
Definition: Box Plot
A box plot is a graphical display that involves a five-number summary of a
distribution of values, consisting of the minimum value, the first quartile, the
median, the third quartile, and the maximum value.
We can construct both vertical or horizontal box plots. In the case of a
horizontal box plot, it is constructed by drawing a box between the quartiles
and
. That is, a box is drawn to indicate the middle 50 percent of the
data values. The left and right sides of the box are called the hinges of the
box plot. Horizontal lines are then drawn from the middle of the sides of
the box to the minimum and maximum values. These horizontal lines are
called whiskers. A vertical line inside the box marks the median. Outliers
are usually indicated by a dot or by an asterisk.
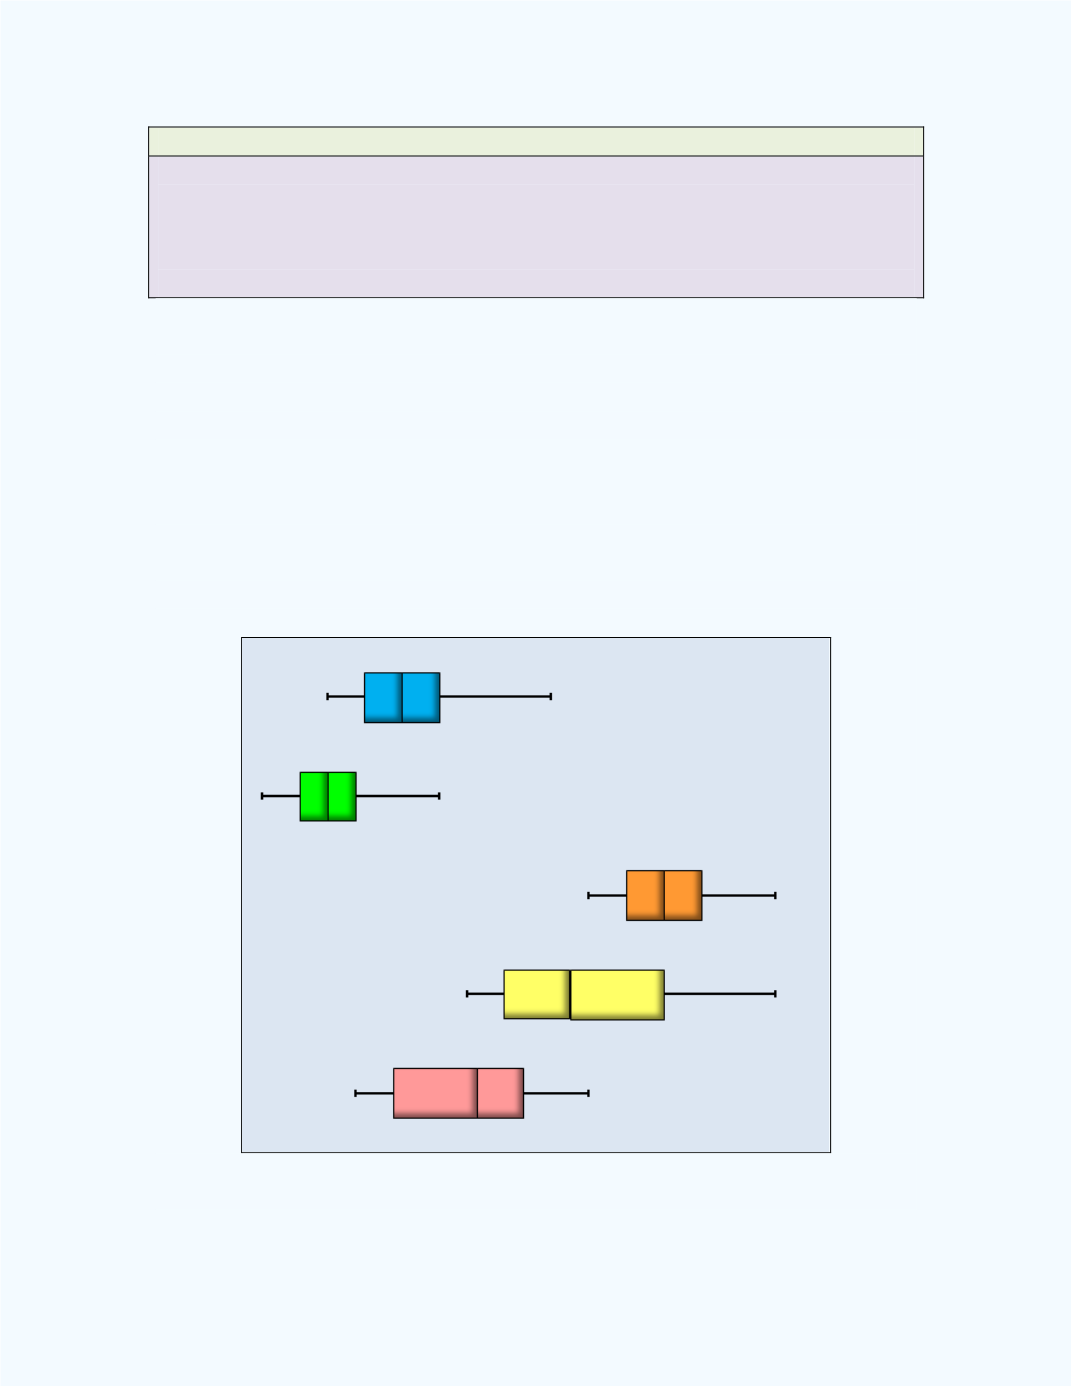
Figure 4-22
shows
examples of horizontal box plots. Note one can use the
Multiple Box Plot
workbook to create the box plots.
Figure 4-22:
Examples of Horizontal Box Plots