


 170 / 762

170
Chapter 4: Measures of Position
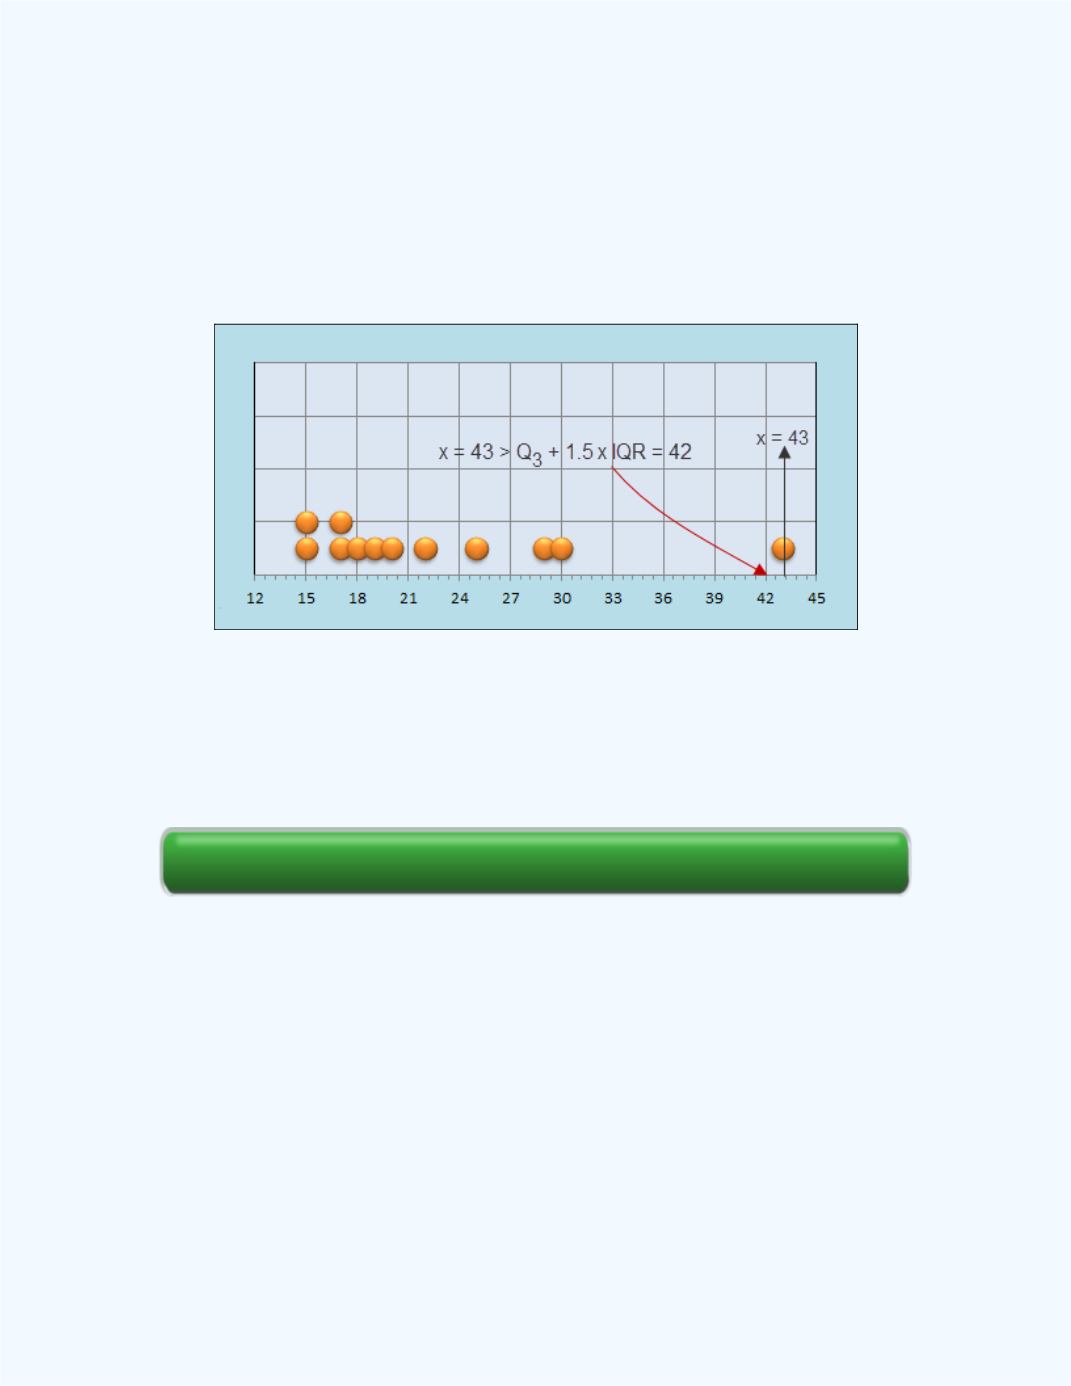
That is, the lifespan of 43 years is an outlier relative to the life spans of the
other 11 peasants who lived in the dark ages.
Figure 4-21
shows the dot plot representation for the lifespan of the
peasants showing that a lifespan of 43 years is an outlier relative to the rest
of the ages in the data set.
Figure 4-21:
Pictorial representation for results for
Example 4-9
Section Review
4-5 Box Plots
In this section we will use the concepts developed in this and earlier chapters
to help create a graphical display called a box plot.
e-Self Review