


 176 / 762

176
Chapter 4: Measures of Position
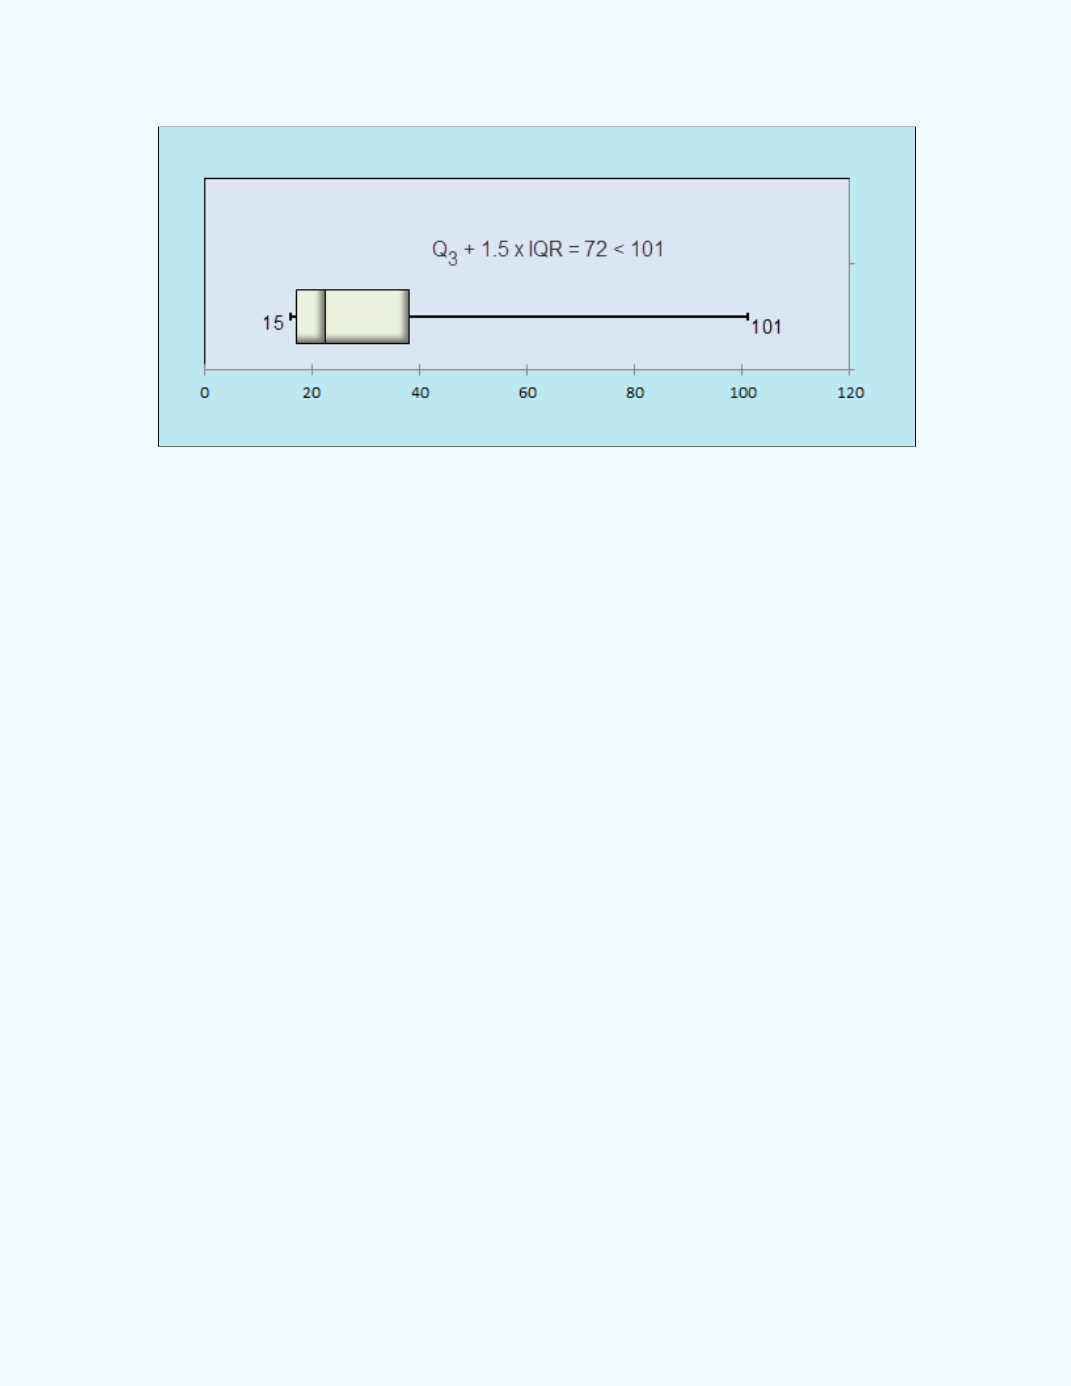
Figure 4-26:
Box Plot with the upper inner fence and the
outlier for
Example 4-11
Next we will discuss another test which one can use to test for outliers. This
test is referred to as the
Outer Fence Test
.
Outer Fence Test
Some authors also compute the interval [
- 3
,
+ 3
].
These endpoints are called the
outer fences
of the box plot. Using these end
points, another procedure can be presented using the inner and outer fences
to determine whether a data value can be classified as a “suspected” outlier
or if the value can be classified as an “outright” outlier. This procedure for
testing for an outlier is much more conservative than that of
the Inner
Fence Test
. This is so because the value has to be outside the outer fences
for it to be classified as an outlier.
A data value may be classified as a “suspected” outlier if it falls between the
limits of the inner and outer fences, including the values of the fences.
A data value may be classified as an “outright” outlier if it falls outside the
limits of the outer fences.
Figure 4-27
graphically shows when a data value may be classified as a
suspected or outright outlier.